Comparative Study
. 2003 Aug;85(2):1111-27.
doi: 10.1016/S0006-3495(03)74548-2.

Solvation of nucleosides in aqueous mixtures of organic solvents: relevance to DNA open basepairs

Affiliations
Comparative Study

Solvation of nucleosides in aqueous mixtures of organic solvents: relevance to DNA open basepairs

Anas M Ababneh et al. Biophys J. 2003 Aug.

Abstract

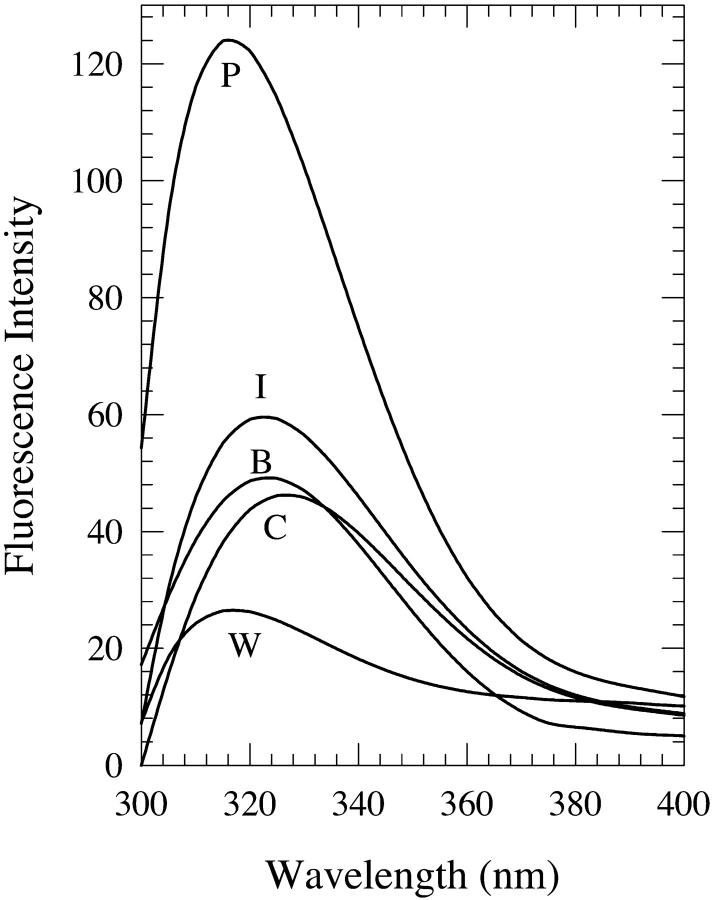
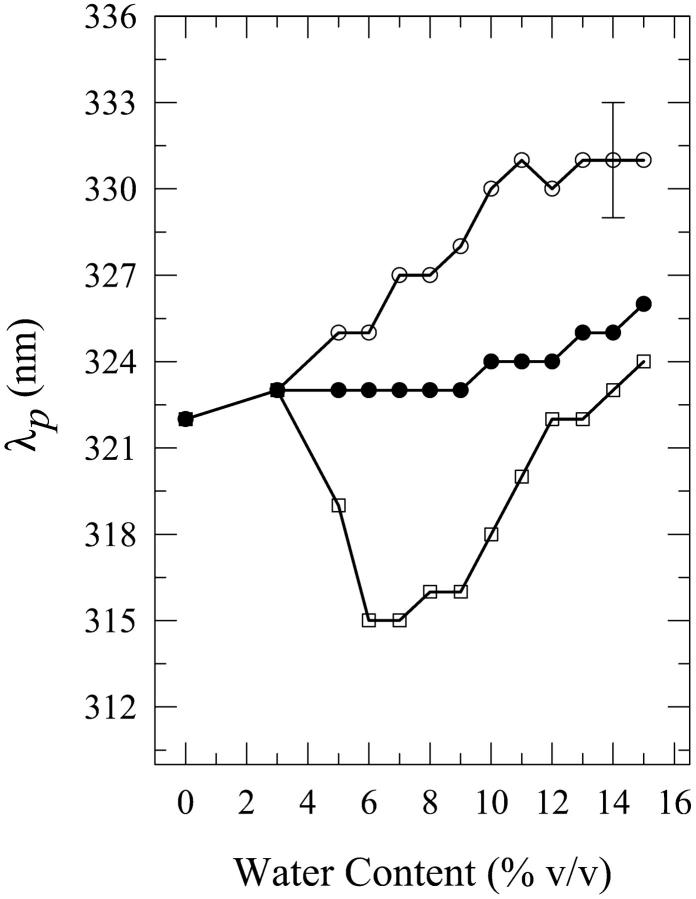
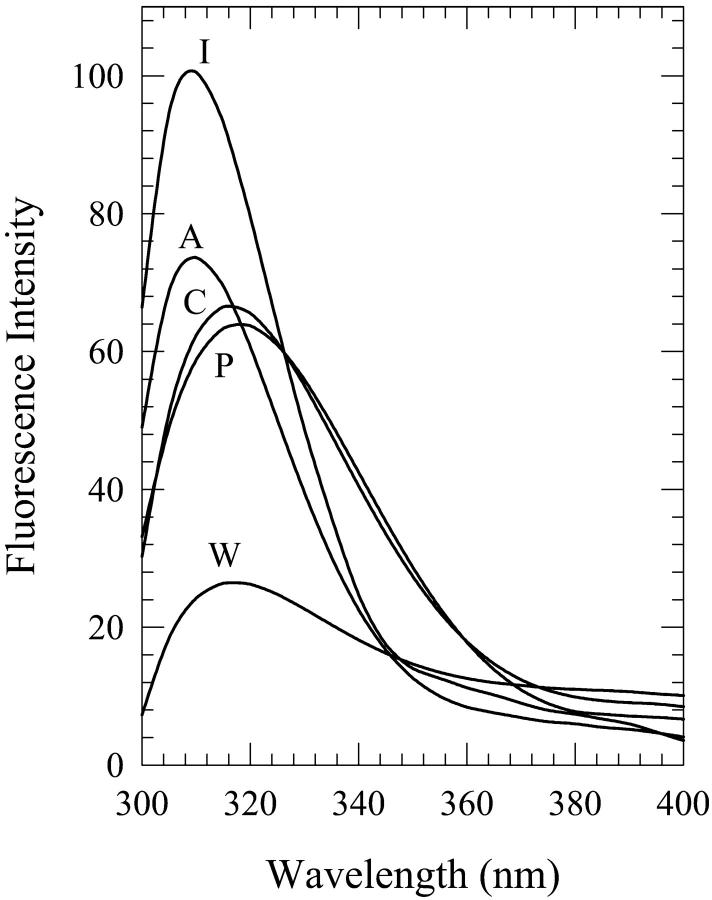
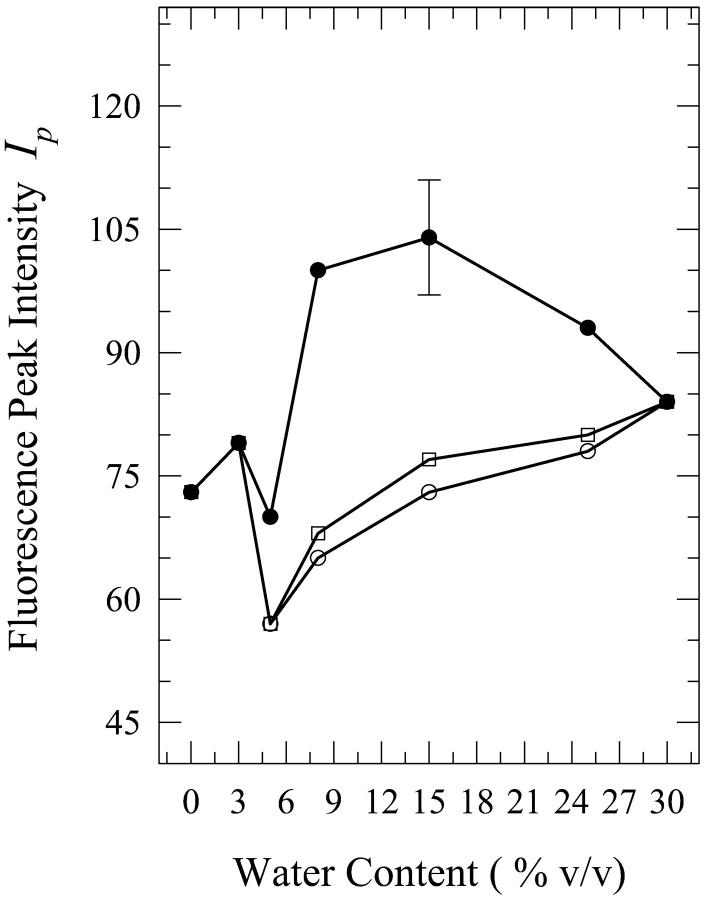
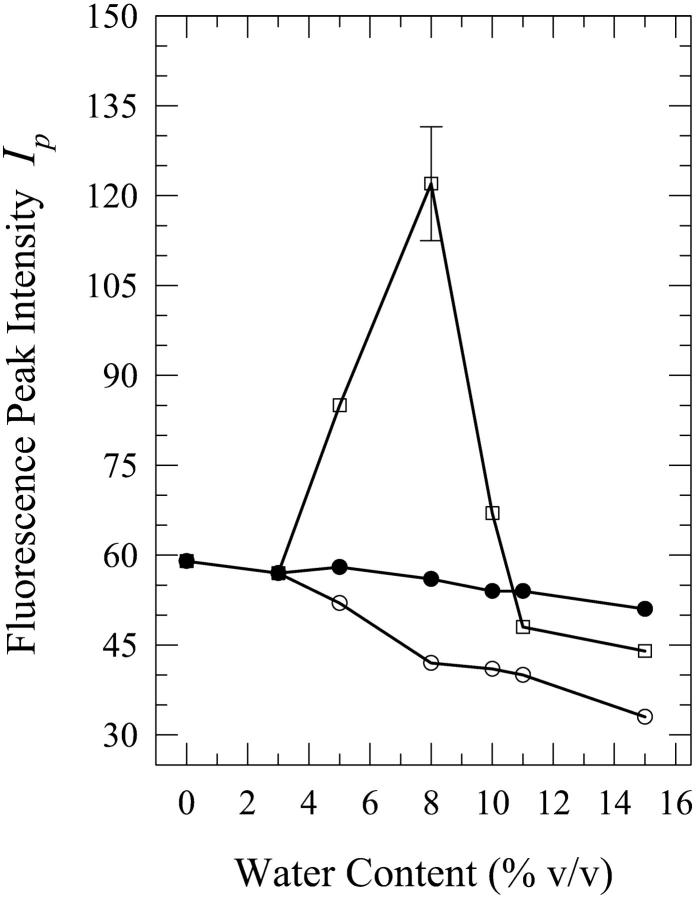
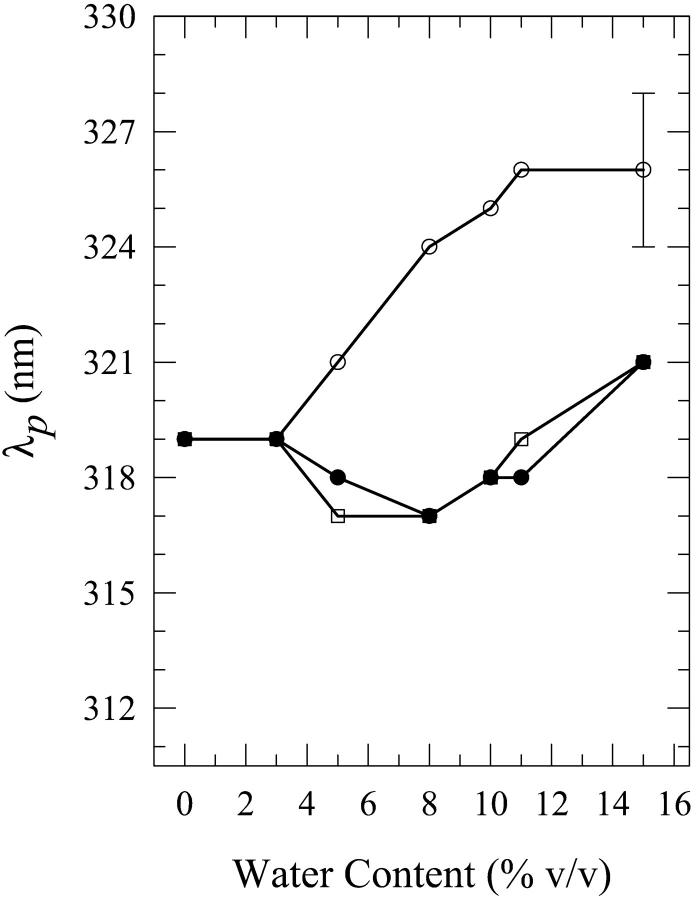
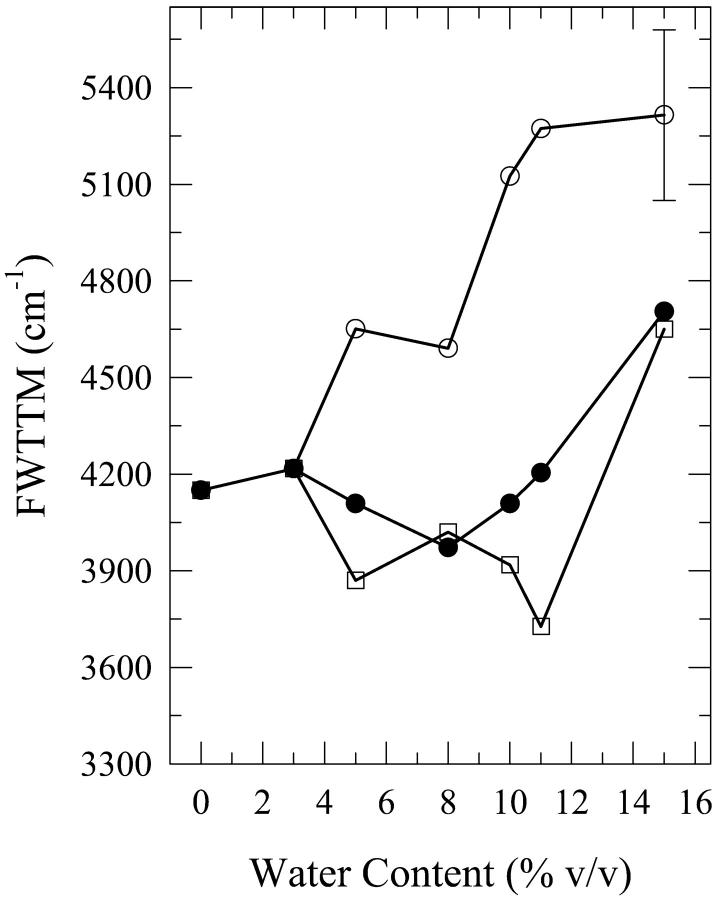
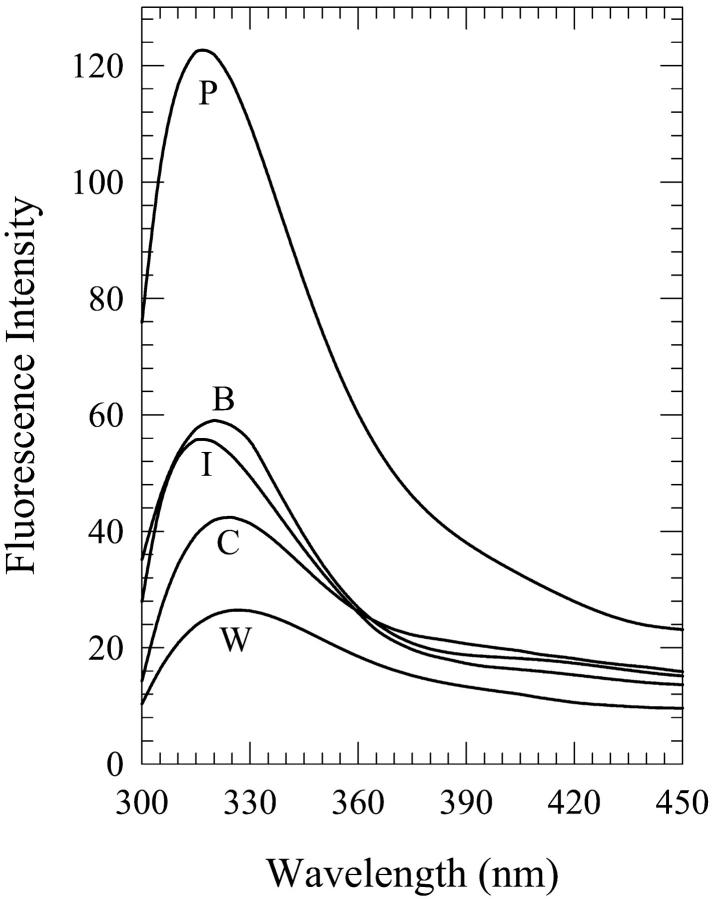
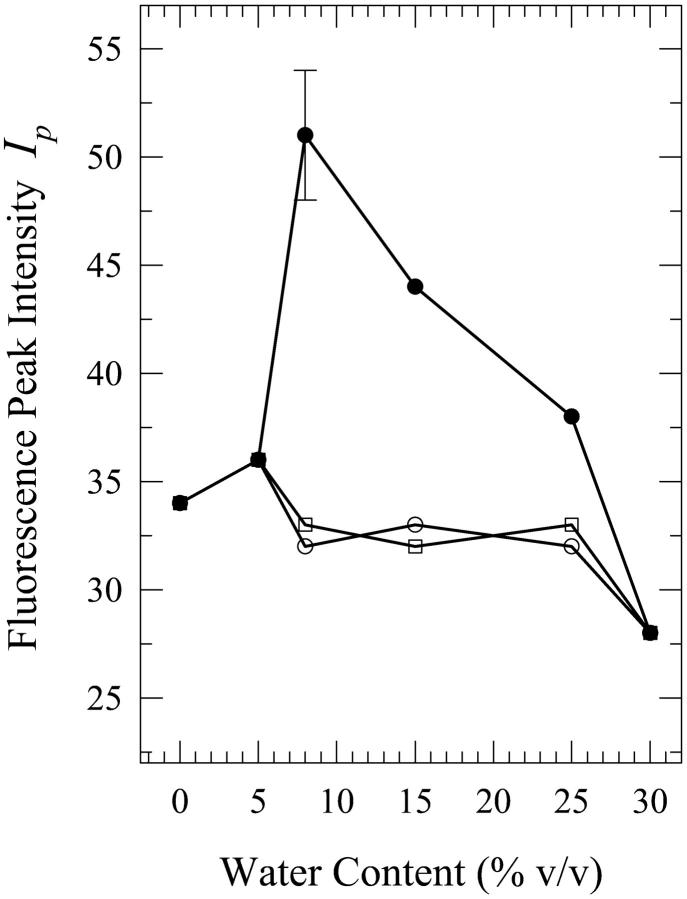
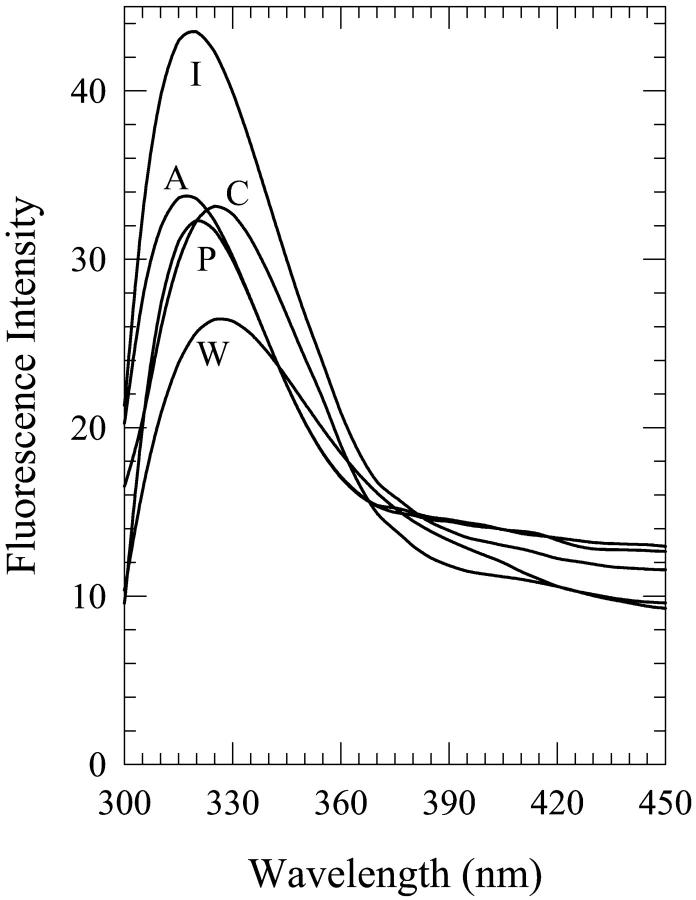
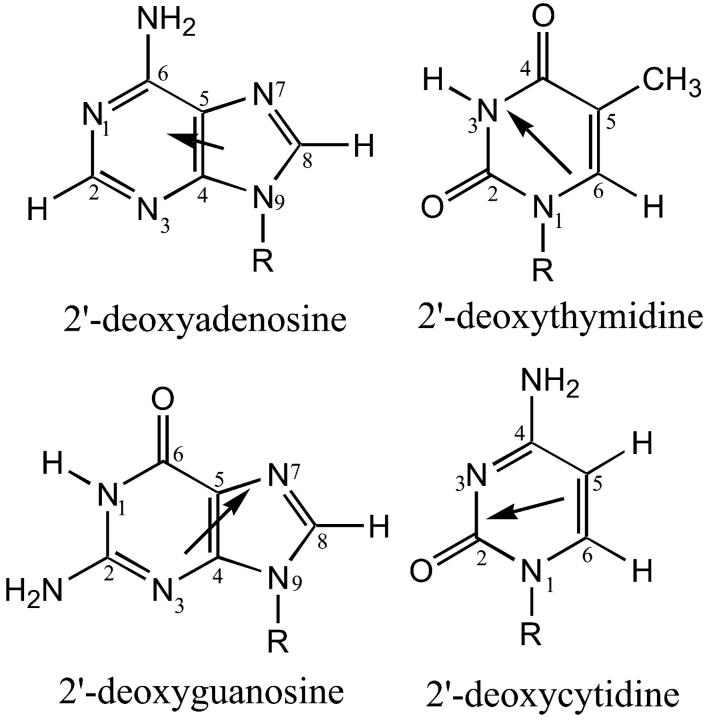
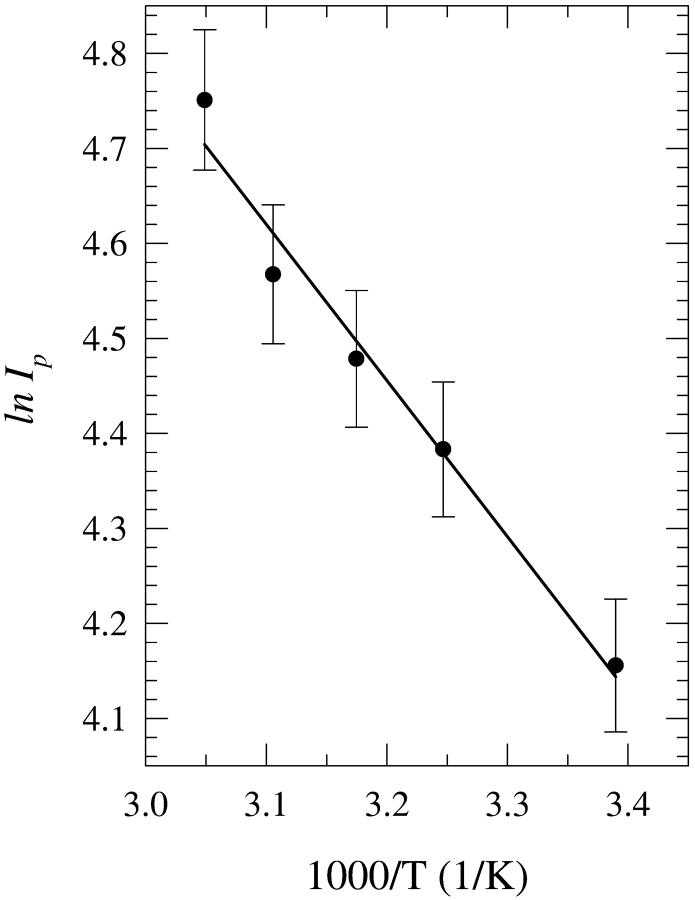
Toward the goal of understanding how open basepairs in DNA interact with their heterogeneous environment, we have studied the steady-state intrinsic fluorescence properties of the purine and pyrimidine deoxynucleosides in organic solvents in the presence of small amounts of water. The organic solvents used in the present study were: n-butanol, acetonitrile, methanol, n-propanol, isopropanol, and isobutanol. For n-butanol and acetonitrile, which have a high degree of amphiphilicity and weak hydrogen bonding ability, respectively, the fluorescence spectral properties of the purines are found to depend on the sequence of steps in which the aqueous mixtures were formed. By contrast, no such dependence was observed in the mixtures with any of the other solvents used in the present study. Moreover, no such dependence was observed for the pyrimidines. These findings suggest that the final solvation network around the purines is dependent on the nature of the environment to which they were initially exposed. This would tend to present an impediment to the closing of AT or GC basepairs in DNA that become open as a result of structural fluctuations, DNA bending, or protein-DNA interactions.


Figures

FIGURE 1
FIGURE 1
Fluorescence spectra of 2′-deoxyadenosine (dA) in 8% (v/v) water-n-butanol mixtures designated as “premixed” (P), “carry its own water” (C), and “injected water” (I) solutions. (The preparation of these solutions was done as described under Materials and Methods). Also shown are the spectra in neat n-butanol (B) and water (W).
FIGURE 2
FIGURE 2
Plot of the fluorescence peak intensity Ip for “premixed” (open squares), “carry its own water” (open circles), and “injected water” (filled circles) solutions of 2′-deoxyadenosine (dA) in n-butanol aqueous mixtures as a function of the water content (% v/v). The lines do not represent fits to the data; they have been drawn to guide the eye. The error bars indicate the largest standard deviation for these data.
FIGURE 3
FIGURE 3
Plot of the wavelength of the fluorescence spectral peak λp for “premixed” (open squares), “carry its own water” (open circles), and “injected water” (filled circles) solutions of 2′-deoxyadenosine (dA) in n-butanol aqueous mixtures as a function of the water content (% v/v). For dA in water, λp = 319 ± 2 nm. The lines do not represent fits to the data; they have been drawn to guide the eye. The error bars indicate the largest standard deviation for these data.
FIGURE 4
FIGURE 4
Fluorescence spectra of 2′-deoxyadenosine (dA) in 8% (v/v) water-acetonitrile mixtures designated as “premixed” (P), “carry its own water” (C), and “injected water” (I) solutions. Also shown are the spectra in neat acetonitrile (A) and water (W).
FIGURE 5
FIGURE 5
Plot of the fluorescence peak intensity Ip for “premixed” (open squares), “carry its own water” (open circles), and “injected water” (filled circles) solutions of 2′-deoxyadenosine (dA) in acetonitrile aqueous mixtures as a function of the water content (% v/v). The lines do not represent fits to the data; they have been drawn to guide the eye. The error bars indicate the largest standard deviation for these data.
FIGURE 6
FIGURE 6
Plot of the fluorescence peak intensity Ip for “premixed” (open squares), “carry its own water” (open circles), and “injected water” (filled circles) solutions of 2′-deoxyguanosine (dG) in n-butanol aqueous mixtures as a function of the water content (% v/v). The lines do not represent fits to the data; they have been drawn to guide the eye. The error bars indicate the largest standard deviation for these data.
FIGURE 7
FIGURE 7
Plot of the wavelength of the fluorescence spectral peak λp for “premixed” (open squares), “carry its own water” (open circles), and “injected water” (filled circles) solutions of 2′-deoxyguanosine (dG) in n-butanol aqueous mixtures as a function of the water content (% v/v). For dG in water, λp = 327 ± 2 nm. The lines do not represent fits to the data; they have been drawn to guide the eye. The error bars indicate the largest standard deviation for these data.
FIGURE 8
FIGURE 8
Plot of the full width at two-third maximum (FWTTM) for the fluorescence spectra of “premixed” (open squares), “carry its own water” (open circles), and “injected water” (filled circles) solutions of 2′-deoxyguanosine (dG) in n-butanol aqueous mixtures as a function of the water content (% v/v). For dG in water, FWTTM = 5040 ± 260 cm−1. The lines do not represent fits to the data; they have been drawn to guide the eye. The error bars indicate the largest standard deviation for these data.
FIGURE 9
FIGURE 9
Fluorescence spectra of 2′-deoxyguanosine (dG) in 8% (v/v) water-n-butanol mixtures designated as “premixed” (P), “carry its own water” (C), and “injected water” (I) solutions. Also shown are the spectra in neat n-butanol (B) and water (W).
FIGURE 10
FIGURE 10
Plot of the fluorescence peak intensity Ip for “premixed” (open squares), “carry its own water” (open circles), and “injected water” (filled circles) solutions of 2′-deoxyguanosine (dG) in acetonitrile aqueous mixtures as a function of the water content (% v/v). The lines do not represent fits to the data; they have been drawn to guide the eye. The error bars indicate the largest standard deviation for these data.
FIGURE 11
FIGURE 11
Fluorescence spectra of 2′-deoxyguanosine (dG) in 15% (v/v) water-acetonitrile mixtures designated as “premixed” (P), “carry its own water” (C), and “injected water” (I) solutions. Also shown are the spectra in neat acetonitrile (A) and water (W).
FIGURE 12
FIGURE 12
Structures of the four deoxynucleosides used in the present study: 2′-deoxyadenosine (dA), 2′-deoxyguanosine (dG), 2′-deoxythymidine (dT), and 2′-deoxycytidine (dC). Also shown are the directions of the permanent dipole moments of the nucleosides (Clementi et al., 1969; Bloomfield et al., 1974).
FIGURE 13
FIGURE 13
Plot of the natural logarithm of the fluorescence peak intensity Ip of the spectra of 2′-deoxyadenosine (dA) in 8% (v/v) “carry its own water” solutions in acetonitrile as a function of 1/T, where T is the absolute incubation temperature. The solutions were heated for 20 min and were then allowed to cool to room temperature before the fluorescence spectra were measured. The error bars indicate the standard deviation.

References

    1. Alyoubi, A. O., and R. H. Hilal. 1995. A theoretical and experimental investigation of the electronic spectra and tautomerism of nucleobases. Biophys. Chem. 55:231–237. - PubMed
    1. Bergman, D. L., and A. Laaksonen. 1998. Topological and spatial structure in the liquid water-acetonitrile mixture. Phys. Rev. E. 58:4706–4715.
    1. Berman, H. M. 1994. Hydration of DNA: take 2. Curr. Opin. Struct. Biol. 4:345–350.
    1. Bernet, J., K. Zakrzewska, and R. Lavery. 1997. Modeling base pair opening: the role of helical twist. J. Mol. Struct. 398–399:473–482.
    1. Bertie, J. E., and Z. Lan. 1997. Liquid water-acetonitrile mixtures at 25°C: the hydrogen-bonded structure studied through infrared absolute integrated absorption intensities. J. Phys. Chem. B. 101:4111–4119.

Publication types

LinkOut - more resources