. 2003 Aug 4;162(3):469-79.
doi: 10.1083/jcb.200212067. Epub 2003 Jul 28.

Regulation of cell death in mitotic neural progenitor cells by asymmetric distribution of prostate apoptosis response 4 (PAR-4) and simultaneous elevation of endogenous ceramide

Affiliations

Regulation of cell death in mitotic neural progenitor cells by asymmetric distribution of prostate apoptosis response 4 (PAR-4) and simultaneous elevation of endogenous ceramide

Erhard Bieberich et al. J Cell Biol. .

Abstract

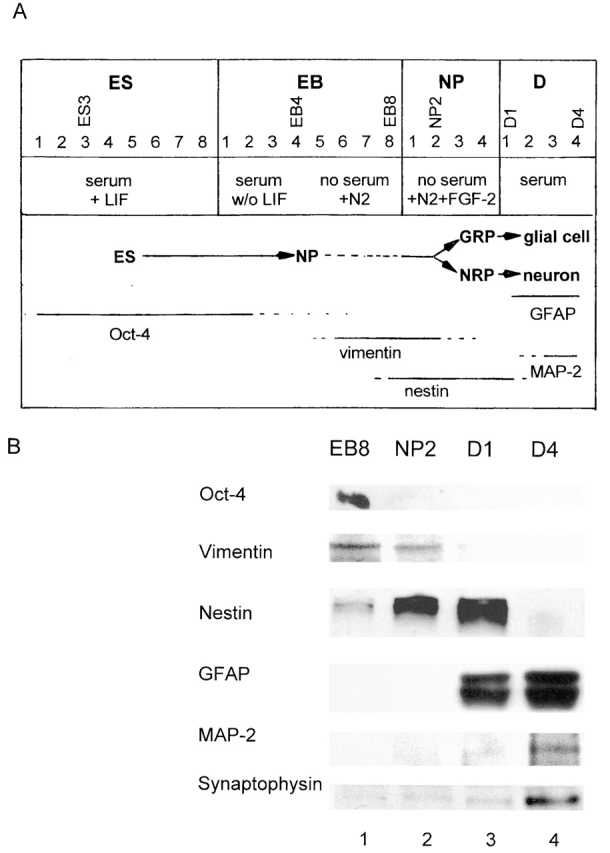
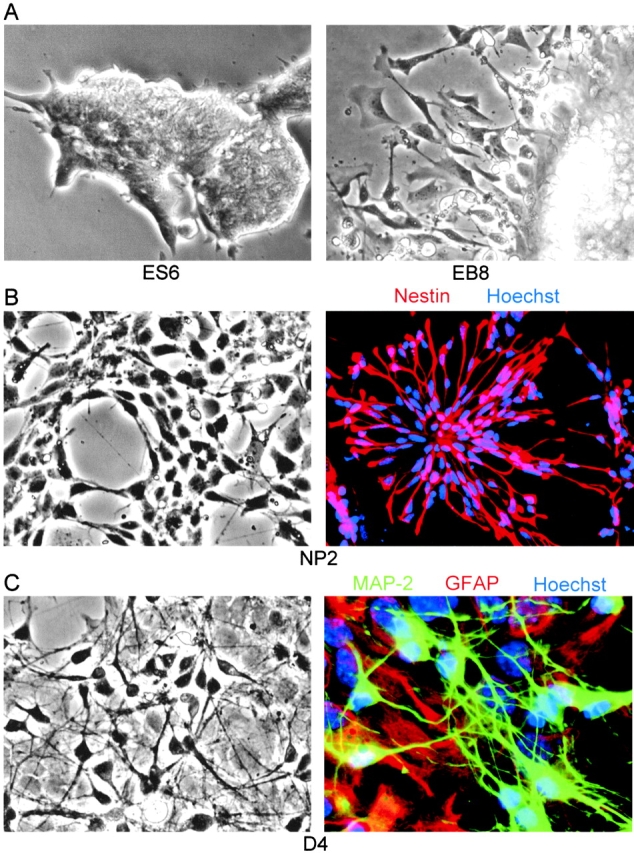
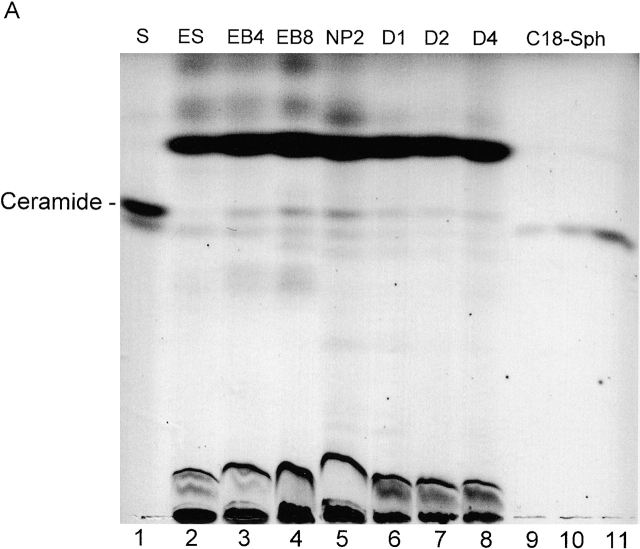
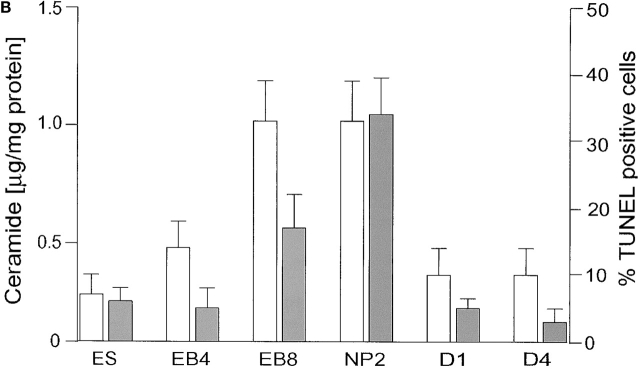
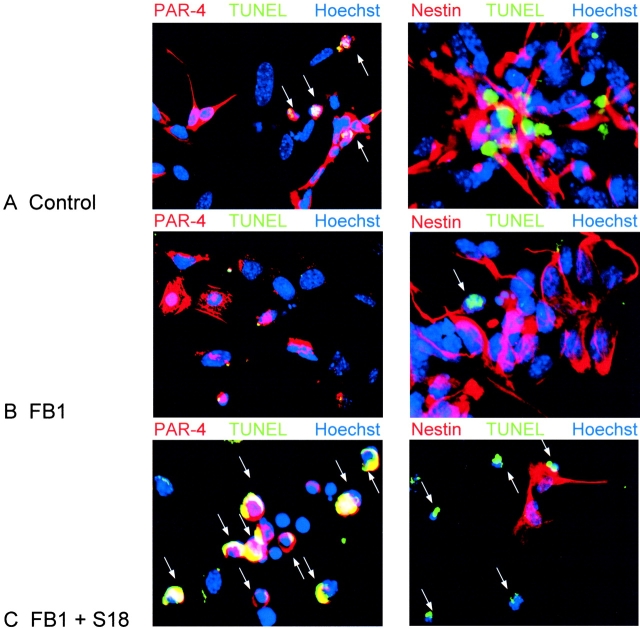
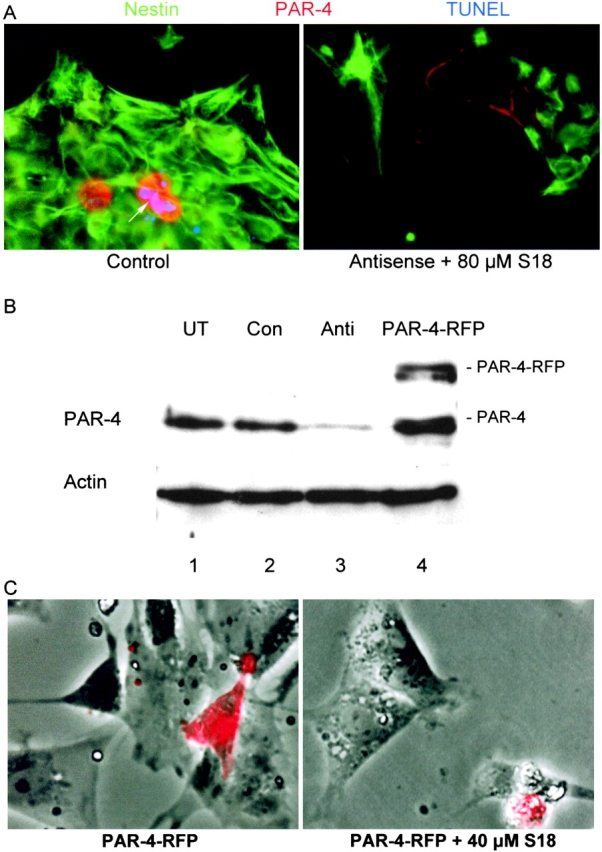
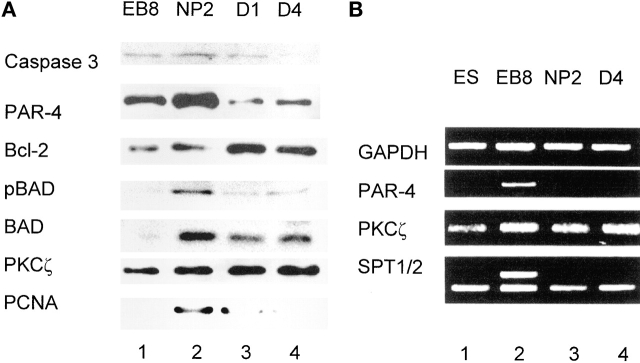
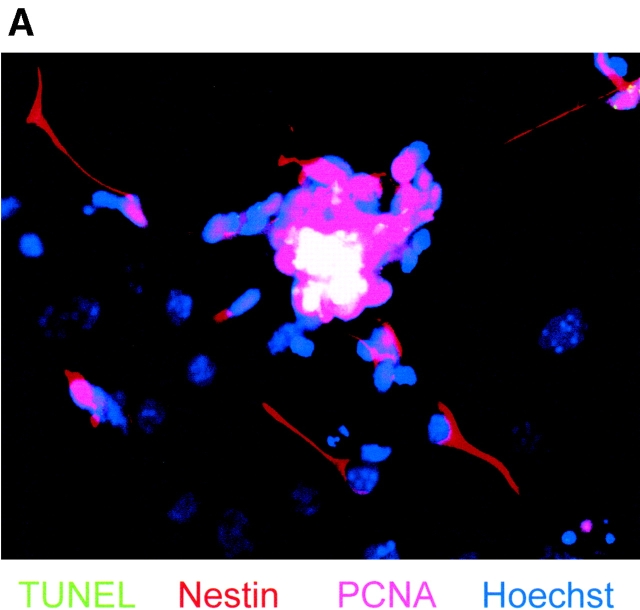
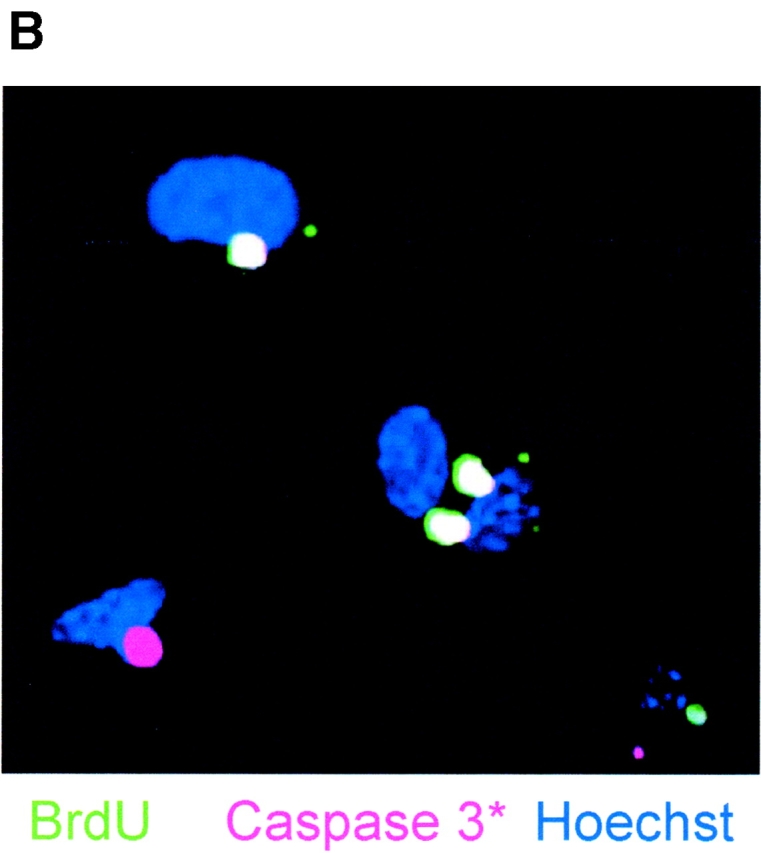
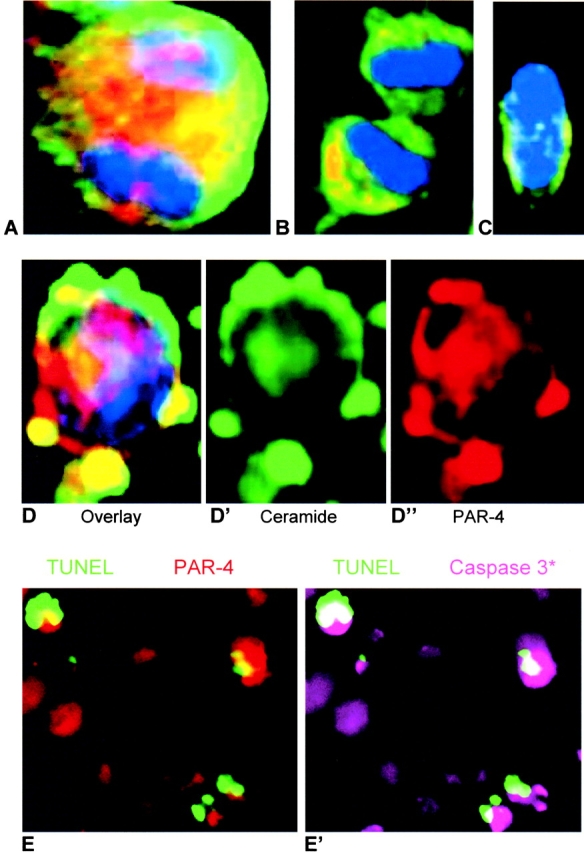
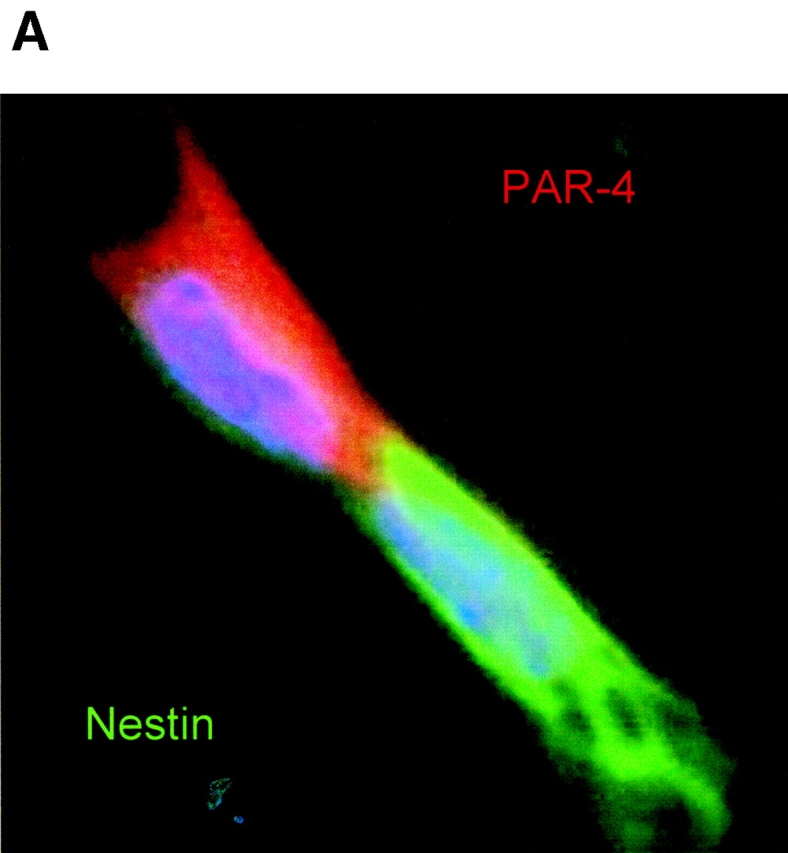
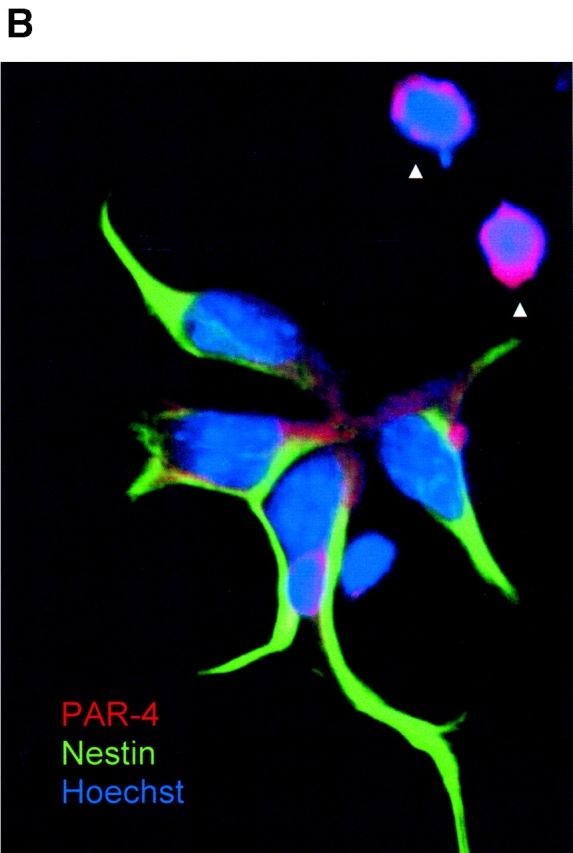
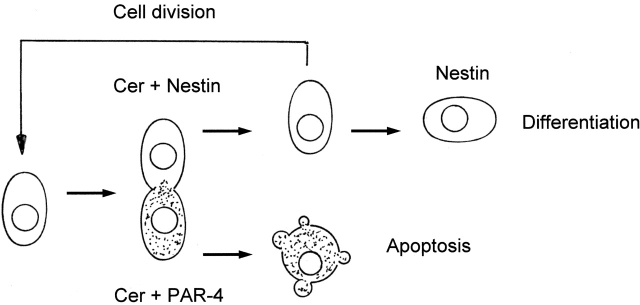
Cell death and survival of neural progenitor (NP) cells are determined by signals that are largely unknown. We have analyzed pro-apoptotic signaling in individual NP cells that have been derived from mouse embryonic stem cells. NP formation was concomitant with elevated apoptosis and increased expression of ceramide and prostate apoptosis response 4 (PAR-4). Morpholino oligonucleotide-mediated antisense knockdown of PAR-4 or inhibition of ceramide biosynthesis reduced stem cell apoptosis, whereas PAR-4 overexpression and treatment with ceramide analogs elevated apoptosis. Apoptotic cells also stained for proliferating cell nuclear antigen (a nuclear mitosis marker protein), but not for nestin (a marker for NP cells). In mitotic cells, asymmetric distribution of PAR-4 and nestin resulted in one nestin(-)/PAR-4(+) daughter cell, in which ceramide elevation induced apoptosis. The other cell was nestin(+), but PAR-4(-), and was not apoptotic. Asymmetric distribution of PAR-4 and simultaneous elevation of endogenous ceramide provides a possible mechanism underlying asymmetric differentiation and apoptosis of neuronal stem cells in the developing brain.


Figures

Figure 1.
Figure 1.
In vitro neuronal differentiation of ES cells, overview, and marker protein expression. ES, embryonic stem cell; EB, embryoid body; NP, neuronal progenitor cell; GRP, glial restricted precursor cells; NRP, neuronal restricted precursor cell (for terminology, see Mayer-Proschel et al., 1997; Wu et al., 2002). In B, immunostaining for marker proteins was performed with protein extracts from stem cells at the differentiation stages shown in A.
Figure 2.
Figure 2.
In vitro neuronal differentiation of ES cells, morphology, and histochemical characterization. (A) ES6, ES cells 2 d in feeder-free cultures; EB8, EBs after 4 d in serum-free medium; (B) NP2, NPs after 2 d in FGF-2 containing, serum-free medium; nestin (red), Hoechst (blue); (C) D4, differentiated neurons and glial cells after 4 d in serum-containing medium; MAP-2 (green), GFAP (red), Hoechst (blue). For differentiation stages, see Fig. 1A. GFAP, glial fibrillary acidic protein; MAP-2, microtubuli-associated protein 2.
Figure 3.
Figure 3.
Ceramide content and apoptosis during in vitro neuronal differentiation of ES cells. (A) Neutral lipids were purified from differentiating ES cells and a lipid amount corresponding to 750 μg of cellular protein/lane separated by HPTLC in the running solvent CH3Cl/HOAc (9:1, vol/vol). Lipids were stained with the cupric acetate reagent. Ceramide (open bars) was quantified by densitometric analysis and comparison with known amounts of standard lipid (N-oleoyl sphingosine). Lane 1, ceramide standard from bovine brain; lane 2, fibroblast-freed ES cells, after 4 d in culture; lane 3, EBs at the EB4 stage; lane 4, EBs at the EB8 stage; lane 5, NPs at the NP2 stage; lanes 6–8, three terminal differentiation stages, 24 (D1 stage), 48 (D2 stage), and 96 h (D4 stage) on cultivation of NP cells in serum-containing medium; lanes 9–11, N-oleoyl sphingosine, 250, 500, and 1,000 ng, respectively. (B) Lipids were extracted from differentiated ES cells and the amount of ceramide quantified using the DAG kinase assay. Apoptosis (solid bars) was determined by TUNEL staining. For HPTLC, DAG kinase, and TUNEL analyses, experiments were performed with five independent ES cultures. The bars show the standard mean and deviation of percentage of TUNEL-positive cells that were counted in five areas of 200 cells in each experiment.
Figure 3.
Figure 3.
Ceramide content and apoptosis during in vitro neuronal differentiation of ES cells. (A) Neutral lipids were purified from differentiating ES cells and a lipid amount corresponding to 750 μg of cellular protein/lane separated by HPTLC in the running solvent CH3Cl/HOAc (9:1, vol/vol). Lipids were stained with the cupric acetate reagent. Ceramide (open bars) was quantified by densitometric analysis and comparison with known amounts of standard lipid (N-oleoyl sphingosine). Lane 1, ceramide standard from bovine brain; lane 2, fibroblast-freed ES cells, after 4 d in culture; lane 3, EBs at the EB4 stage; lane 4, EBs at the EB8 stage; lane 5, NPs at the NP2 stage; lanes 6–8, three terminal differentiation stages, 24 (D1 stage), 48 (D2 stage), and 96 h (D4 stage) on cultivation of NP cells in serum-containing medium; lanes 9–11, N-oleoyl sphingosine, 250, 500, and 1,000 ng, respectively. (B) Lipids were extracted from differentiated ES cells and the amount of ceramide quantified using the DAG kinase assay. Apoptosis (solid bars) was determined by TUNEL staining. For HPTLC, DAG kinase, and TUNEL analyses, experiments were performed with five independent ES cultures. The bars show the standard mean and deviation of percentage of TUNEL-positive cells that were counted in five areas of 200 cells in each experiment.
Figure 4.
Figure 4.
Alteration of neural stem cell apoptosis by inhibition of ceramide biosynthesis or incubation with ceramide analogs. (A–C) Differentiating ES cells at the NP2 stage were immunostained for PAR-4 (red, left) and nestin (red, right), apoptotic cells were TUNEL stained (green), and nuclei were counterstained with Hoechst dye (blue). A, control cells without FB1 or the novel ceramide analogue S18; B, cells incubated for 48 h with 25 μM FB1; C, cells incubated for 48 h with FB1 (ceramide depletion) followed by overnight treatment with 80 μM S18. Arrows indicate apoptotic cells.
Figure 5.
Figure 5.
Alteration of neural stem cell apoptosis by antisense knockdown or overexpression of PAR-4. (A) Differentiating ES cells at the NP1 stage were transfected with a morpholino phosphorodiamidate antisense oligonucleotide against PAR-4, and 48 h later (NP3 stage), were incubated overnight with 80 μM S18. The figure shows PAR-4 (red), nestin (green), and TUNEL (blue) staining of cells transfected with standard control antisense oligonucleotide (left), and cells transfected with PAR-4–specific antisense oligonucleotide followed by incubation with S18 (right). (B) Staining of PAR-4 on immunoblots of protein from differentiating ES cells (NP3 stage) that were transfected with or without PAR-4–specific antisense oligonucleotide or PAR-4-RFP, respectively. Lane 1, untransfected (UT) NP cells; lane 2, NP cells transfected with standard control antisense oligonucleotide (Con); lane 3, NP cells transfected with PAR-4–specific antisense oligonucleotide (Anti); lane 4, NP cells transfected with PAR-4-RFP. (C) In differentiating ES cells at the EB8 stage, inhibition of ceramide biosynthesis was initiated by incubation with 50 nM myriocin, and was then maintained throughout the subsequent differentiation stages. After NP expansion (NP1 stage), cells were transfected with PAR-4-RFP, and 48 h later (NP3 stage), were incubated overnight with 80 μM S18 (right). The figure shows phase contrast and overlay with RFP (red) fluorescence. Arrow in A indicates apoptotic cells.
Figure 6.
Figure 6.
Expression of differentiation markers and pro- or anti-apoptotic proteins in differentiating ES cells. (A) During in vitro neural differentiation of ES-J1 mouse ES cells, protein was extracted from the cells, separated by SDS-PAGE, and blotted onto nitrocellulose. Each lane shows the immunostaining corresponding to 35 μg cell protein. See Fig. 1 for definition of differentiation stages. The protein analysis was performed with five independent differentiation experiments. (B) RNA was isolated from differentiating ES-J1 cells (see Fig. 1 for definition of differentiation stages) and subjected to RT-PCR. SPT1/2, SPT subunit 1 and 2. Each experiment was repeated four times.
Figure 7.
Figure 7.
Apoptosis of differentiating ES-J1 ES cells at the NP2 stage of differentiation. Multiple, indirect immunofluorescence staining of differentiating ES-J1 cells 48 h on replating of EB8 cells (NP2 stage). (A) Nestin, (Cy3, red); PCNA, (Cy5, far-red, pseudo-colored as pink); TUNEL, FITC (green); Hoechst (blue). White color shows PCNA- and TUNEL-stained (apoptotic) cells. Pink staining shows cells that are PCNA-positive, but not apoptotic. (B) Cells at the NP2 stage were pulse labeled for 3 h with BrdU, followed by fixation and immunostaining for BrdU (green), activated caspase 3 (Cy5, pseudo-colored as pink), and Hoechst (blue) 5 h after labeling. White staining shows TUNEL- and active caspase 3–stained cells. Pink staining shows only activated caspase 3–positive cells.
Figure 7.
Figure 7.
Apoptosis of differentiating ES-J1 ES cells at the NP2 stage of differentiation. Multiple, indirect immunofluorescence staining of differentiating ES-J1 cells 48 h on replating of EB8 cells (NP2 stage). (A) Nestin, (Cy3, red); PCNA, (Cy5, far-red, pseudo-colored as pink); TUNEL, FITC (green); Hoechst (blue). White color shows PCNA- and TUNEL-stained (apoptotic) cells. Pink staining shows cells that are PCNA-positive, but not apoptotic. (B) Cells at the NP2 stage were pulse labeled for 3 h with BrdU, followed by fixation and immunostaining for BrdU (green), activated caspase 3 (Cy5, pseudo-colored as pink), and Hoechst (blue) 5 h after labeling. White staining shows TUNEL- and active caspase 3–stained cells. Pink staining shows only activated caspase 3–positive cells.
Figure 8.
Figure 8.
Distribution of ceramide and PAR-4 during cell division of ES-J1 ES cells at the NP2 stage of differentiation and caspase 3 activation. Multiple, indirect immunofluorescence staining of differentiating ES-J1 cells 48 h after replating of EB8 cells (NP2 stage). Ceramide, FITC (green); PAR-4, (Alexa® 546, red); Hoechst (blue). A, mitotic cell in anaphase; B, mitotic cell in telophase; C, nonapoptotic cell; D–D′′, apoptotic cell. Leftmost picture (D) shows overlay of ceramide (D′), PAR-4 (D′′), and Hoechst staining; E, overlays of TUNEL (green) and PAR-4 (red) staining or E′, TUNEL (green) and activated caspase 3 (Cy5, pseudo-colored as pink) staining.
Figure 9.
Figure 9.
Distribution of PAR-4 and nestin during cell division of ES-J1 ES cells at NP2 stage of differentiation. Multiple, indirect immunofluorescence staining of differentiating ES-J1 cells 48 h on replating of EB8 cells (NP2 stage). PAR-4, (Alexa® 546, red); nestin, (Alexa® 488, green); Hoechst (blue). (A) Mitotic cell in anaphase/telophase, overlay of PAR-4, nestin, and Hoechst staining. Note the strict asymmetric distribution of PAR-4 and nestin. (B) Cluster of neuroprogenitor cells, overlay of PAR-4, nestin, and Hoechst staining. Arrowheads indicate two apoptotic PAR-4–positive cells that did not show any expression of nestin.
Figure 9.
Figure 9.
Distribution of PAR-4 and nestin during cell division of ES-J1 ES cells at NP2 stage of differentiation. Multiple, indirect immunofluorescence staining of differentiating ES-J1 cells 48 h on replating of EB8 cells (NP2 stage). PAR-4, (Alexa® 546, red); nestin, (Alexa® 488, green); Hoechst (blue). (A) Mitotic cell in anaphase/telophase, overlay of PAR-4, nestin, and Hoechst staining. Note the strict asymmetric distribution of PAR-4 and nestin. (B) Cluster of neuroprogenitor cells, overlay of PAR-4, nestin, and Hoechst staining. Arrowheads indicate two apoptotic PAR-4–positive cells that did not show any expression of nestin.
Figure 10.
Figure 10.
A model for asymmetric apoptosis of NP daughter cells due to the asymmetric distribution of nestin and PAR-4 proteins. Before mitosis or during S-phase, NP cells up-regulate the expression of nestin, PAR-4, and ceramide. During cell division, ceramide is distributed equally to the daughter cells, whereas PAR-4 and nestin are restricted to different daughter cells. The daughter cell with simultaneous presence of PAR-4 and ceramide will die due to apoptosis, whereas the one containing ceramide and nestin will again divide or differentiate. Conversion of ceramide to sphingomyelin and/or glycosphingolipids due to up-regulation of sphingomyelin or glucosyl- or galactosylceramide biosynthesis protects this cell from apoptosis on further cell division or differentiation.

Similar articles

Cited by

References

    1. Bhakar, A.L., L.-L. Tannis, C. Zeindler, M.P. Russo, C. Jobin, D.S. Park, S. MacPherson, and P.A. Barker. 2002. Constitutive nuclear factor-κB activity is required for central neuron survival. J. Neurosci. 22:8466–8475. - PMC - PubMed
    1. Bieberich, E., S. MacKinnon, J. Silva, and R.K. Yu. 2001. Regulation of apoptosis during neuronal differentiation by ceramide and b-series complex gangliosides. J. Biol. Chem. 276:44396–44404. - PubMed
    1. Blaschke, A.J., K. Staley, and J. Chun. 1996. Widespread programmed cell death in proliferative and post-mitotic regions of fetal cerebral cortex. Development. 122:1165–1174. - PubMed
    1. Camandola, S., and M.P. Mattson. 2000. Pro-apoptotic action of Par-4 involves inhibition of NF-κB activity and suppression of bcl-2 expression. J. Neurosci. Res. 61:134–139. - PubMed
    1. Cecconi, F., G. Alvarez-Bolado, B.I. Meyer, K.A. Roth, and P. Gruss. 1998. Apaf1 (CED-4 homolog) regulates programmed cell death in mammalian development. Cell. 94:727–737. - PubMed

Publication types

MeSH terms