

Multiple T cell subsets control Francisella tularensis LVS intracellular growth without stimulation through macrophage interferon gamma receptors
- PMID: 12885873
- PMCID: PMC2194083
- DOI: 10.1084/jem.20030687
Multiple T cell subsets control Francisella tularensis LVS intracellular growth without stimulation through macrophage interferon gamma receptors
Abstract
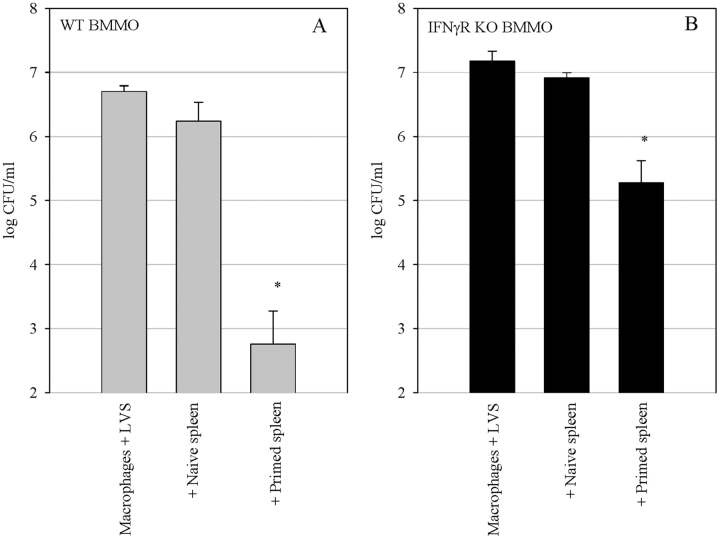
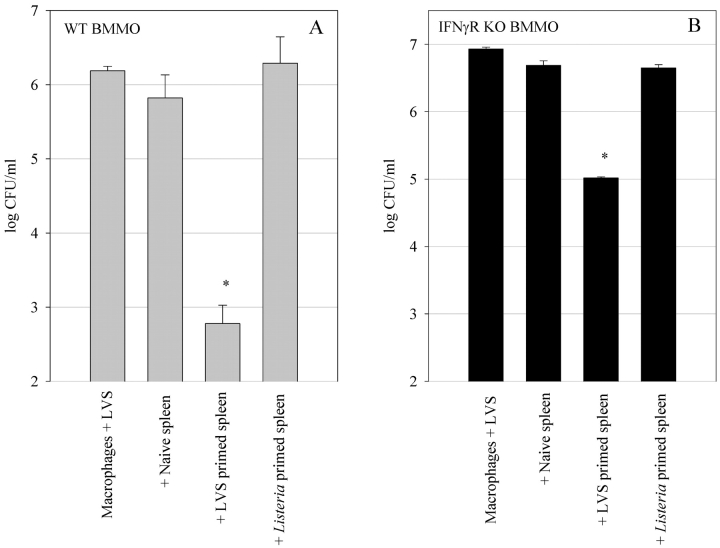
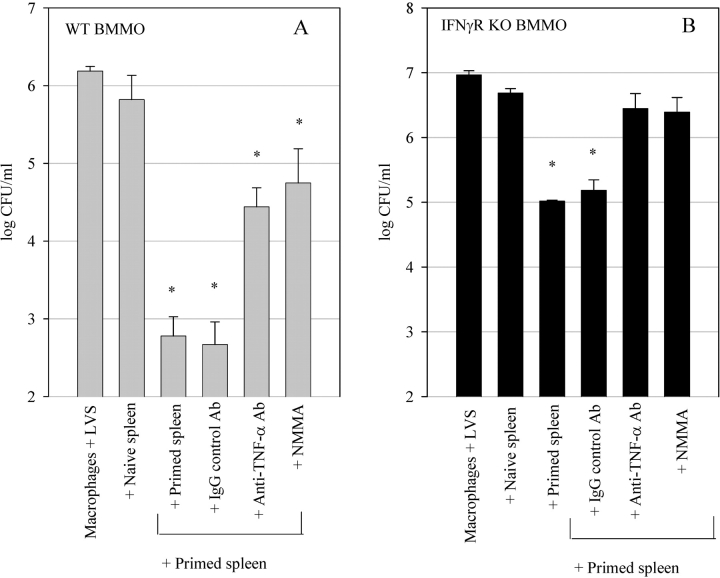
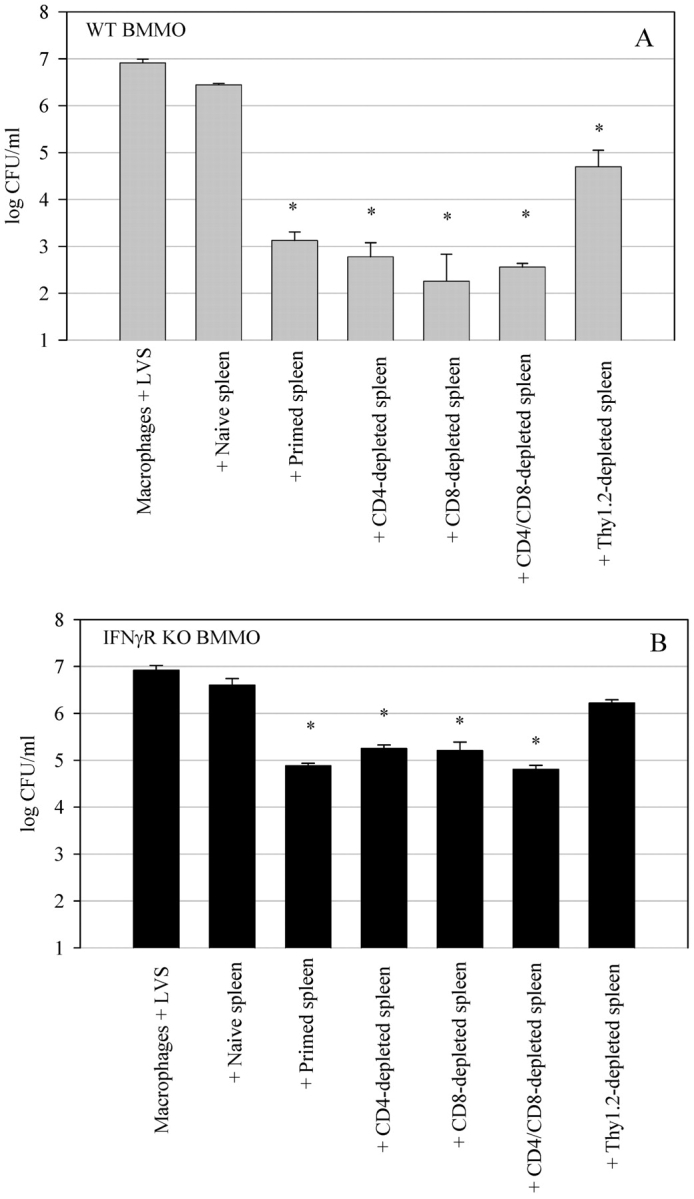
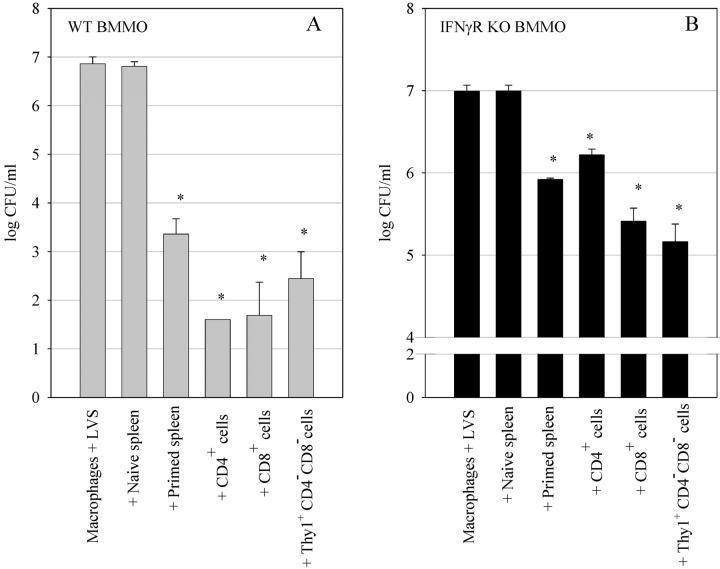
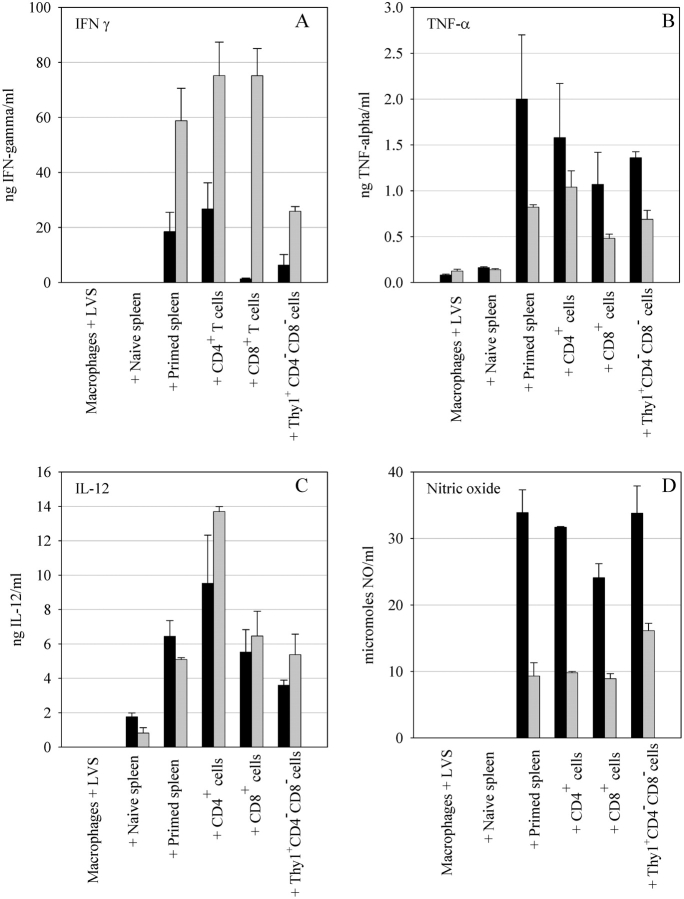
A variety of data suggest that in vivo production of interferon (IFN)-gamma is necessary, but not sufficient, for expression of secondary protective immunity against intracellular pathogens. To discover specific IFN-gamma-independent T cell mediated mechanisms, we took advantage of an in vitro culture system that models in vivo immune responses to the intracellular bacterium Francisella tularensis live vaccine strain (LVS). LVS-immune lymphocytes specifically controlled 99% of the growth of LVS in wild-type murine bone marrow-derived macrophages. Surprisingly, LVS-immune lymphocytes also inhibited LVS intracellular growth by as much as 95% in macrophages derived from IFN-gamma receptor knockout (IFNgammaR KO) mice. CD8+ T cells, and to a lesser degree CD4+ T cells, controlled LVS intracellular growth in both wild-type and IFNgammaR KO macrophages. Further, a unique population of Thy1+alphabeta+CD4-CD8- cells that was previously suggested to operate during secondary immunity to LVS in vivo strongly controlled LVS intracellular growth in vitro. A large proportion of the inhibition of LVS intracellular growth in IFNgammaR KO macrophages by all three T cell subsets could be attributed to tumor necrosis factor (TNF) alpha. Thus, T cell mechanisms exist that control LVS intracellular growth without acting through the IFN-gamma receptor; such control is due in large part to TNF-alpha, and is partially mediated by a unique double negative T cell subpopulation.
Figures
Similar articles
-
Lung CD4-CD8- double-negative T cells are prominent producers of IL-17A and IFN-gamma during primary respiratory murine infection with Francisella tularensis live vaccine strain.J Immunol. 2010 May 15;184(10):5791-801. doi: 10.4049/jimmunol.1000362. Epub 2010 Apr 14. J Immunol. 2010. PMID: 20393138
-
Loss of either CD4+ or CD8+ T cells does not affect the magnitude of protective immunity to an intracellular pathogen, Francisella tularensis strain LVS.J Immunol. 1996 Dec 1;157(11):5042-8. J Immunol. 1996. PMID: 8943413
-
Differential requirements by CD4+ and CD8+ T cells for soluble and membrane TNF in control of Francisella tularensis live vaccine strain intramacrophage growth.J Immunol. 2007 Dec 1;179(11):7709-19. doi: 10.4049/jimmunol.179.11.7709. J Immunol. 2007. PMID: 18025217
-
The live vaccine strain of Francisella tularensis replicates in human and murine macrophages but induces only the human cells to secrete proinflammatory cytokines.J Leukoc Biol. 2005 Jun;77(6):893-7. doi: 10.1189/jlb.1104637. Epub 2005 Mar 9. J Leukoc Biol. 2005. PMID: 15758077 Review.
-
Nitric oxide: cytokine-regulation of nitric oxide in host resistance to intracellular pathogens.Immunol Lett. 1994 Dec;43(1-2):87-94. doi: 10.1016/0165-2478(94)00158-8. Immunol Lett. 1994. PMID: 7537721 Review.
Cited by
-
CXCL16 Stimulates Antigen-Induced MAIT Cell Accumulation but Trafficking During Lung Infection Is CXCR6-Independent.Front Immunol. 2020 Aug 7;11:1773. doi: 10.3389/fimmu.2020.01773. eCollection 2020. Front Immunol. 2020. PMID: 32849637 Free PMC article.
-
The involvement of IL-17A in the murine response to sub-lethal inhalational infection with Francisella tularensis.PLoS One. 2010 Jun 18;5(6):e11176. doi: 10.1371/journal.pone.0011176. PLoS One. 2010. PMID: 20585449 Free PMC article.
-
Host restriction of Escherichia coli recurrent urinary tract infection occurs in a bacterial strain-specific manner.PLoS Pathog. 2018 Dec 13;14(12):e1007457. doi: 10.1371/journal.ppat.1007457. eCollection 2018 Dec. PLoS Pathog. 2018. PMID: 30543708 Free PMC article.
-
Host Immunity and Francisella tularensis: A Review of Tularemia in Immunocompromised Patients.Microorganisms. 2021 Dec 8;9(12):2539. doi: 10.3390/microorganisms9122539. Microorganisms. 2021. PMID: 34946140 Free PMC article. Review.
-
Immunity to Francisella.Front Microbiol. 2011 Feb 16;2:26. doi: 10.3389/fmicb.2011.00026. eCollection 2011. Front Microbiol. 2011. PMID: 21687418 Free PMC article.
References
-
- Tarnvik, A. 1989. Nature of protective immunity to Francisella tularensis. Rev. Infect. Dis. 11:440–451. - PubMed
-
- Dennis, D.T., T.V. Inglesby, D.A. Henderson, J.G. Bartlett, M.S. Ascher, E. Eitzen, A.D. Fine, A.M. Friedlander, J. Hauer, M. Layton, et al. 2001. Tularemia as a biological weapon: medical and public health management. JAMA. 285:2763–2773. - PubMed
-
- Eigelsbach, H.T., and C.M. Downs. 1961. Prophylactic effectiveness of live and killed tularemia vaccines. J. Immunol. 87:415–425. - PubMed
-
- Elkins, K.L., S.C. Cowley, and C.M. Bosio. 2003. Innate and adaptive immune responses to an intracellular bacterium, Francisella tularensis live vaccine strain. Microbes Infect. 5:132–142. - PubMed
MeSH terms
Substances
LinkOut - more resources
Full Text Sources
Molecular Biology Databases
Research Materials
Miscellaneous
