Comparative Study
. 2003 Aug;122(2):133-45.
doi: 10.1085/jgp.200308844.

Side-chain charge effects and conductance determinants in the pore of ClC-0 chloride channels

Affiliations
Comparative Study

Side-chain charge effects and conductance determinants in the pore of ClC-0 chloride channels

Mei-Fang Chen et al. J Gen Physiol. 2003 Aug.

Abstract

The charge on the side chain of the internal pore residue lysine 519 (K519) of the Torpedo ClC-0 chloride (Cl-) channel affects channel conductance. Experiments that replace wild-type (WT) lysine with neutral or negatively charged residues or that modify the K519C mutant with various methane thiosulfonate (MTS) reagents show that the conductance of the channel decreases when the charge at position 519 is made more negative. This charge effect on the channel conductance diminishes in the presence of a high intracellular Cl- concentration ([Cl-]i). However, the application of high concentrations of nonpermeant ions, such as glutamate or sulfate (SO42-), does not change the conductance, suggesting that the electrostatic effects created by the charge at position 519 are unlikely due to a surface charge mechanism. Another pore residue, glutamate 127 (E127), plays an even more critical role in controlling channel conductance. This negatively charged residue, based on the structures of the homologous bacterial ClC channels, lies 4-5 A from K519. Altering the charge of this residue can influence the apparent Cl- affinity as well as the saturated pore conductance in the conductance-Cl- activity curve. Amino acid residues at the selectivity filter also control the pore conductance but mutating these residues mainly affects the maximal pore conductance. These results suggest at least two different conductance determinants in the pore of ClC-0, consistent with the most recent crystal structure of the bacterial ClC channel solved to 2.5 A, in which multiple Cl--binding sites were identified in the pore. Thus, we suggest that the occupancy of the internal Cl--binding site is directly controlled by the charged residues located at the inner pore mouth. On the other hand, the Cl--binding site at the selectivity filter controls the exit rate of Cl- and therefore determines the maximal channel conductance.


Figures

F<sc>igure</sc> 1.
Figure 1.
Positions of the mutated pore residues of ClC channels. Side views of the E. coli ClC channel. Extracellular side is on top. Structural coordinates are taken from Protein Data Bank (code 1OTS) with the cocrystallized antibody molecules removed. (A) Residues of the bacterial ClC channel that correspond to those of ClC-0 examined in the present study. The color codes are (ClC-0 numbers in parentheses): blue, T452 (K519); red, E111 (E127); purple, I448 (I515); yellow, S107 (S123); orange, Y445 (Y512). Cl ions at Scen and Sint are shown in green. Arrows indicate the intracellular pore entrances. (B) Stereo view of the mutated residues in the pore. Only those residues in the left subunit in A are shown. The residues (same color codes as in A) are represented by sticks to show the relations of their side chains with the two Cl ions in the pore. Thin faint ribbons represent helices D and R, on which these residues are located.
F<sc>igure</sc> 2.
Figure 2.
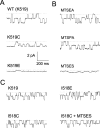
The charge from position 519 exerts more influence on the conductance of ClC-0 than that from position 518. All recording traces are from excised inside-out patches. (A) Recordings of WT (K519), K519C, and K519E mutants. In all experiments, [Cl]o = 120 mM, [Cl]i = 300 mM, and Vm = −80 mV. (B) Single-channel recordings of the K519C mutant after the introduced cysteine is modified with MTSEA, MTSPA, and MTSES. Same recording conditions as in A. (C) Effect of the charge placed at position 518 on the channel conductance. Single-channel recordings were made at −90 mV. [Cl]o = 120 mM and [Cl]i = 120 mM. For the recording of the MTSES-modified I518C, the trace was taken 110 s after the application of 300 μM MTSES to the patch. Scale bars in A apply to B.
F<sc>igure</sc> 3.
Figure 3.
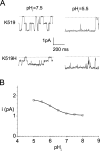
Effect of intracellular pH on the single-channel conductance of the WT (K519) or K519H channel. (A) Single-channel recording traces of K519 and K519H channels at two different pHi. Dotted lines are the zero-current level. The ionic conditions are as in Fig. 2 A. Vm = −70 mV. (B) Titration of the single-channel current of the K519H channel by pHi. Experimental conditions are as described in A. The current values were determined between the zero-current level and the fully open level in the amplitude histogram (because of the sparsity of the middle current level at low pHi), therefore reflecting the sum of the current of two pores. Solid curve is drawn according to a logistic function, A1 + (A2 − A1)/(1 + [H+]o/Ka), where Ka is the dissociation constant of protonation. The minimal (A1) and maximal (A2) current were 1.02 and 1.82 pA, respectively. The fitted pKa is 6.18.
F<sc>igure</sc> 4.
Figure 4.
Single-channel recordings of ClC-0 channels with various charges at position 519 in different [Cl]i. For all recordings, the pipette (extracellular) solution contains 120 mM Cl. [Cl]i is varied as indicated. Vm = −110 mV. Dotted lines represent zero-current level.
F<sc>igure</sc> 5.
Figure 5.
Dependence of ClC-0 conductance on internal Cl. (A) Single-channel i-V curves of the WT, K519C, and K519E channels at various [Cl]i. Data points were derived from experiments like those in Fig. 4. All current amplitudes were measured from single pores. Numbers in the plots are the internal Cl concentrations. (B) Single-channel conductance of the WT and the mutant channels as a function of intracellular Cl activity. Symbols are: squares, WT (K519); circles, K519C; triangles, K519E. Solid curves are fitted to a Michaelis-Menten equation (Eq. 1b). See Table I for the values of the fitted parameters, gmax and K1/2.
F<sc>igure</sc> 6.
Figure 6.
Absence of charge screening by a nonpermeant ion, SO4 2−, on the conductance of the WT channel. (A) Single-channel recording traces of the WT channel at 120 mM symmetric [Cl] with or without various concentrations of SO4 2− (sodium salt) being added to the internal solution. (B) Single-channel i-V curves from recordings like those shown in A. [Cl]i = 120 mM. (C) Single-channel i-V curves from another set of experiments. [Cl]i = 60 mM.
F<sc>igure</sc> 7.
Figure 7.
Gating and permeation properties of the E127Q mutant at the single-channel level. (A) Comparison of single-channel current between WT and the E127Q channels at various [Cl]i. All recordings were with the excised inside-out configuration. The pipette solution contains 120 mM Cl, and the Cl concentrations at the intracellular side are indicated on the left. (B) Voltage-dependent gating of the E127Q mutant derived from single-channel recordings. (Left) Single-channel recordings from excised inside-out patches at three voltages. Symmetrical 120 mM [Cl]. (Right) Mean P o-V curve of the E127Q mutant. Solid curve is the P o-V curve of the WT channel.
F<sc>igure</sc> 8.
Figure 8.
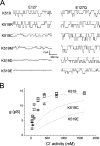
Comparison of the charge effects from position 519 on the single-channel current with or without E127Q mutation. (A) Single-channel recording traces of single (residue 519, left) and double mutants (residues 127 and 519, right) of ClC-0. All recordings were from the excised inside-out patch. [Cl]i and [Cl]o were 120 and 300 mM, respectively. Vm = −110 mV. (B) Conductance of double mutants at positions 127 and 519 as a function of internal Cl activity. Symbols are: squares, E127Q/K519; circles, E127Q/K519C; triangles, E127Q/K519E. Dotted curves are the same curves as those in Fig. 5 B. Curve fittings to Eq. 1b for the double mutants are not shown. The fitted values for gmax and K1/2 are shown in Table I.
F<sc>igure</sc> 9.
Figure 9.
Effects of a positive charge at position 127 and 515 on the single-channel conductance of ClC-0. (A) Representative single-channel traces for WT (E127/K519), the single-point mutant K519E, I515K and the double mutant E127K/K519E. Vm = −110 mV; [Cl]o = 120 mM; [Cl]i are as indicated. (B) Comparison of the conductance-Cl activity curves of E127K/K519E (filled circles) and I515K (open squares) with those of the WT, K519C, and K519E channels (dotted curves). Solid curve is the best fit of the data points from E127K/K519E double mutant to Eq. 1b. The fitted gmax and K1/2 are 8.5 pS and 27.5 mM, respectively.
F<sc>igure</sc> 10.
Figure 10.
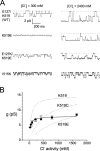
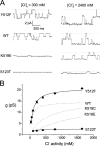
Conductance determinants along the pore of ClC-0. (A) Single-channel recording traces of the S123T and Y512F mutants at two [Cl]i. For comparisons, the traces for the WT and K519E channels are also shown. All recording traces were taken at −110 mV. [Cl]o = 120 mM. (B) Conductance-Cl activity curves of the S123T and Y512F mutants. Data points were fitted to Eq. 1b, with gmax and K1/2 values shown in Table I. Dotted curves are those of WT, K519C, and K519E channels.
Figure
Figure

Comment in

Similar articles

Cited by

References

    1. Andersen, O.S. 1989. Kinetics of ion movement mediated by carriers and channels. Methods Enzymol. 171:62–112. - PubMed
    1. Bauer, C.K., K. Steinmeyer, J.R. Schwarz, and T.J. Jentsch. 1991. Completely functional double-barreled chloride channel expressed from a single Torpedo cDNA. Proc. Natl. Acad. Sci. USA. 88:11052–11056. - PMC - PubMed
    1. Bell, J., and C. Miller. 1984. Effects of phospholipid surface charge on ion conduction in the K+ channel of sarcoplasmic reticulum. Biophys. J. 45:279–287. - PMC - PubMed
    1. Chen, M.-F., and T.-Y. Chen. 2001. Different fast-gate regulation by external Cl− and H+ of the muscle-type ClC chloride channel. J. Gen. Physiol. 118:23–32. - PMC - PubMed
    1. Chen, T.-Y. 1998. Extracellular zinc ion inhibits ClC-0 chloride channels by facilitating slow gating. J. Gen. Physiol. 112:715–726. - PMC - PubMed

Publication types

Substances