. 2003 Aug;77(16):8650-60.
doi: 10.1128/jvi.77.16.8650-8660.2003.

Reverse genetic system for the analysis of parvovirus telomeres reveals interactions between transcription factor binding sites in the hairpin stem

Affiliations

Reverse genetic system for the analysis of parvovirus telomeres reveals interactions between transcription factor binding sites in the hairpin stem

Erik Burnett et al. J Virol. 2003 Aug.

Abstract

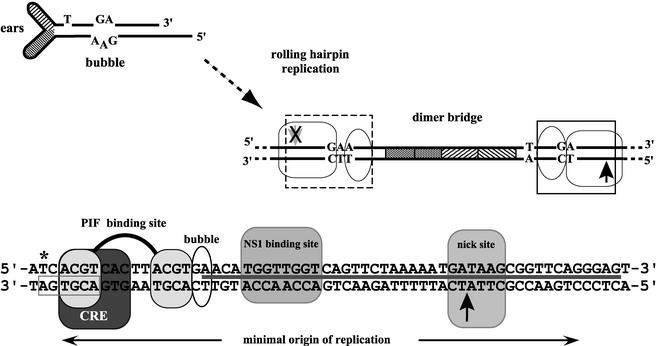
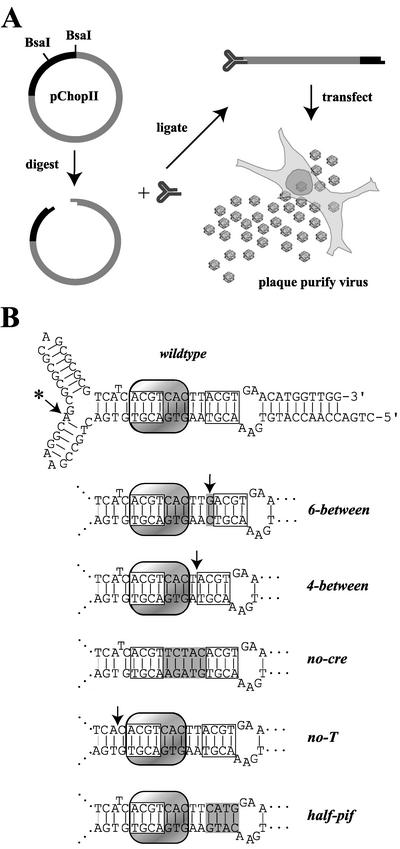
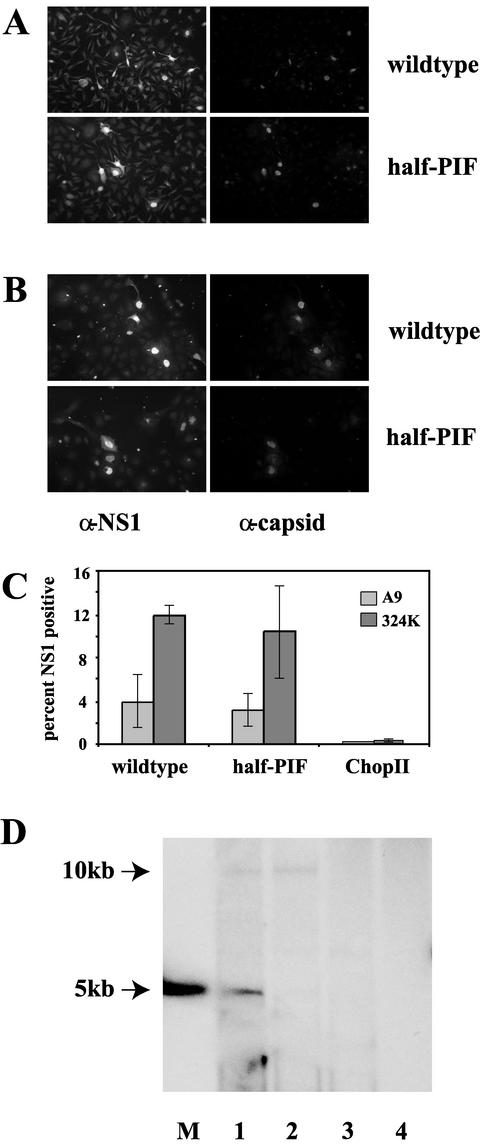
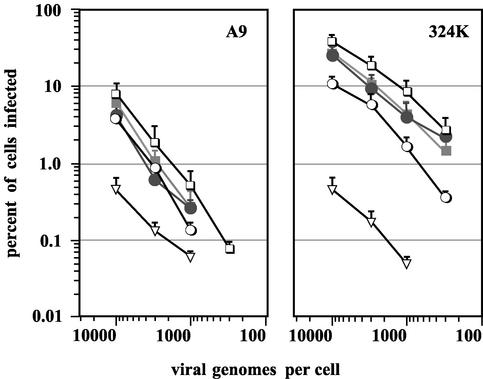
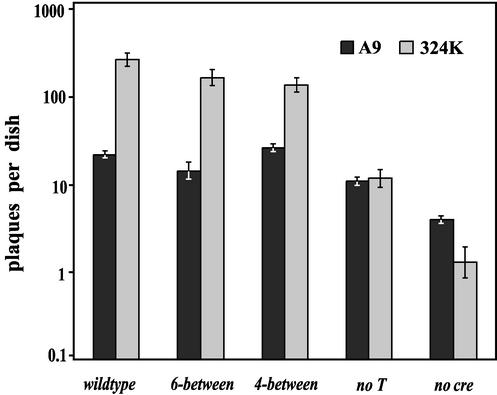
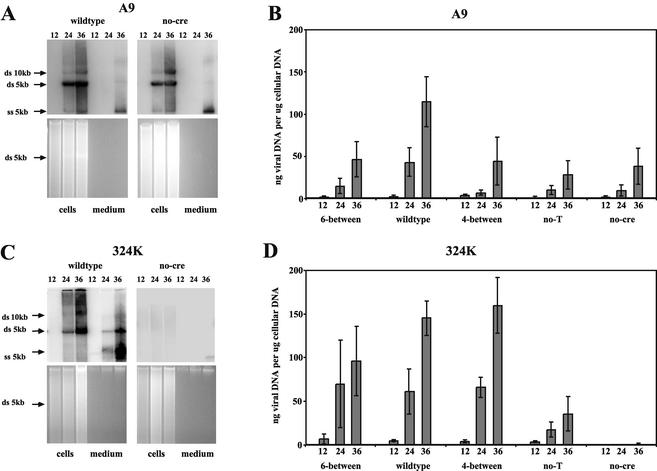
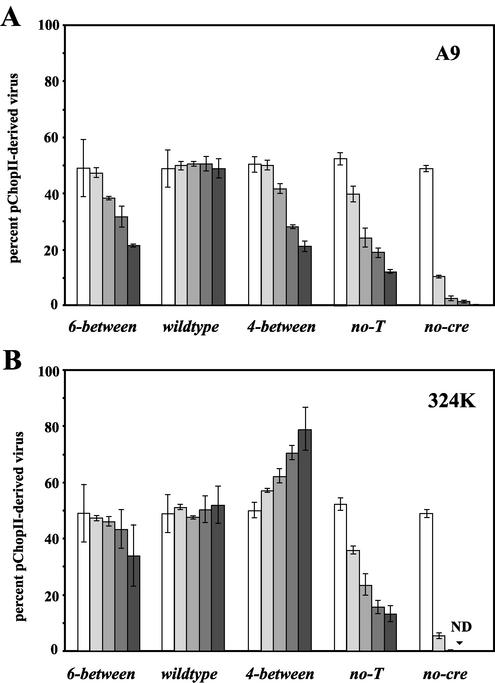
The left-hand or 3'-terminal hairpin of minute virus of mice (MVM) contains sequence elements essential for both viral DNA replication at the left-hand origin (oriL) and for the modulation of the P4 promoter, from which the viral nonstructural gene cassette is transcribed. This hairpin sequence has proven difficult to manipulate in the context of the viral genome. Here we describe a system for generating mutant viruses using synthetic hairpin oligonucleotides and a truncated form of the infectious clone. This allows manipulation of the sequence of the left-hand hairpin and examination of the effects in the context of the viral life cycle. We have confirmed the requirement for a functional parvovirus initiation factor (PIF) binding site and determined that an optimized PIF binding site, with 6 bases between the half-sites, was actually detrimental to viral growth. The distal PIF half-site overlaps a cyclic AMP-responsive element (CRE), which was shown to play an important role in initiating infection, particularly in 324K simian virus 40-transformed human fibroblasts. Interestingly, reducing the spacing of the PIF half-sites, and thus the affinity of the binding site for PIF, increased viral fitness relative to wild type in 324K cells, but not in murine A9 cells. These results indicate that the relative importance of factor binding to the CRE and PIF sites during the establishment of an infection differs markedly between these two host cells and suggest that the suboptimal spacing of PIF half-sites found in wild-type virus represents a necessary reduction in the affinity of the PIF interaction in favor of CRE function.


Figures

FIG. 1.
FIG. 1.
The dimer junction and left-hand minimal origin of replication. The left-hand hairpin of MVM is shown in diagrammatic form. Asymmetries such as the small ears, extra-helical T, and bubble sequence are indicated. The fully duplex, dimer junction, generated by rolling hairpin replication, is shown on the right. The short, palindromic sequences derived from the hairpin ears are represented by cross-hatched boxes. The minimal active origin is boxed, with an arrow indicating the nick site. The equivalent sequence generated on the GAA side of the bubble is also boxed; however, the arrow at the potential nick site is crossed out to indicate that it is not an active origin. Sequence details of the active left-hand origin are shown at the bottom of the figure. The minimal sequence required for origin activity is indicated by the double-headed arrow. Sequences of the bubble and the PIF, CREB, and NS1 binding sites are indicated, as is the NS1 nick site (12). An asterisk indicates the position of the extra-helical T, now base paired, and the gray box below it indicates the 7-of-8 match to the palindromic CRE consensus discussed in the text. The solid line between the complementary strands indicates the NS1 footprint.
FIG. 2.
FIG. 2.
The MVM-Chop system for generating mutations in the left-hand terminal hairpin. (A) A map of pChopII, indicating the two BsaI restriction sites, is shown in the upper left, where gray indicates MVM sequence and black indicates bacterial vector. Digestion with BsaI and subsequent gel purification produced a 6-kb linear DNA with noncohesive 5′ overhangs at each end. Synthetic oligonucleotides that regenerate the terminal hairpin were ligated to the linearized plasmid. This construct was transfected into permissive cells from which mutant virus could be plaque purified for future analysis. (B) The sequence of the wild-type oligonucleotide is shown in hairpin form, with the two PIF half-sites and the CRE indicated by open and shaded boxes, respectively. The arrow with an asterisk indicates the identification of an A residue which differs from the previously published MVMp sequence, as discussed in the text. The sequences of the central regions of mutant hairpin oligonucleotides used in this study are shown below the wild-type hairpin. Altered and deleted sequences are indicated by gray boxes and arrows, respectively. Ellipses (…) indicate continuation of the wild-type sequence.
FIG. 3.
FIG. 3.
Transfected half-pif expresses NS1 and capsid proteins. (A and B) Fluorescence microscopy was used to detect NS1 and VP expression during a single-round infection in A9 (A) or 324K (B) cells transfected with either wild-type or half-pif ligation products, as indicated. Cells were fixed 48 h posttransfection and then stained for NS1 (fluorescein isothiocyanate) and capsids (Texas Red), as indicated above the panels. (C) Bar graph showing the average percentage of NS1-positive cells, determined by counting 10 fields equivalent to those shown in panel A, following transfection with either wild-type or half-pif or with pChopII vector in the absence of hairpin oligonucleotide. Error bars represent 1 standard deviation from the mean. (D) DNA extracted by the modified Hirt procedure from 324K cells at48 h posttransfection was digested to completion with DpnI, run on native agarose gels, blotted, and then probed for MVM DNA. A double-stranded version of the MVM genome used as a marker is shown in the lane labeled M. Lanes 1 and 2 contain DNA extracted from wild-type and half-pif transfections, respectively, while DNA extracted from pChopII vector alone in transfected and untransfected cells is shown in lanes 3 and 4, respectively.
FIG. 4.
FIG. 4.
Relative efficiency of viral infection initiation. Infection initiation dose responses were determined by measuring the percentage of NS1-positive nuclei 24 h postinfection in rapidly dividing A9 or 324K cells, using immunofluorescence, over a 30-fold range of input multiplicities. Infections were initiated at 10,000, 3,300, 1,100, and 360 genomes per cell. Each data point is the average percentage of NS1-positive cells from at least 10 randomly chosen fields at a magnification of ×200 (approximately 200 A9 cells or 100 324K cells per field). □, wild-type; •, 6-between; ▪, 4-between; ▿, no-cre; ○, no-T. For clarity, standard deviations from the mean are shown with the top error bar only.
FIG. 5.
FIG. 5.
Plaque-forming abilities of mutant viruses in A9 and 324K cells. Plaque assays were performed in A9 and 324K cells by using serial dilutions of virus stocks adjusted to an equal genome concentration. Results were normalized to 5 × 10⁶ viral genomes per dish and are plotted on a logarithmic scale. Error bars represent one standard deviation from the mean of three experiments.
FIG. 6.
FIG. 6.
Relative DNA replication under one-step growth conditions. (A and C) DNA extracted from single-cycle infections using wild-type and no-cre viruses in A9 (A) and 324K (C) cells, with autoradiographs positioned above the gels from which they were created by Southern blotting. Individual lanes are aligned and contain total DNA extracted at 12, 24, and 36 h postinfection and then digested with BsaI. DNA extracted from equivalent amounts of both cells and medium are shown for each time point. The gels were stained with ethidium bromide, and the position of the double-stranded (ds) 5-kb band is shown. (B and D) On the Southern blots, the positions of 10-kb and 5-kb viral double-stranded bands, as well as those of 5-kb single-stranded (ss) progeny genomes, are indicated. Results for all five viruses, tested in A9 (B) and 324K (D) cells, are expressed in graphic form as the quantity of viral DNA (in nanograms), normalized to the amount of total DNA (in micrograms) in each sample. Each bar represents three independent experiments, with the standard deviations indicated. The numbers under each bar of the graph indicate hours postinfection.
FIG. 7.
FIG. 7.
Design and validation of the virus competition system. (A) The nucleotide sequence of pChopII, numbered according to the method of Astell et al. (1), is indicated above the equivalent sequence of pChopIII, with altered nucleotides shown in bold. The predicted amino acid sequences of the VP proteins generated by both vectors are shown below the nucleotide sequences, numbered according to the amino acid sequence of VP2. Boxes indicate the sequences of the oligonucleotides Chop2 and Chop3 used as the discriminating probes in panel D. (B) Infection initiation assays performed with wild-type and wild-type-var viruses. Initiation efficiencies were determined as described in the legend for Fig. 4 by NS1 immunofluorescence, measured in rapidly dividing A9 cells. Infections were initiated at 200, 1,000, and 5,000 genomes per cell. For clarity, standard deviations from the mean are shown with the top error bars only, and the data points for wild-type-var (wt-v) are offset slightly to the left of those for wild-type (wt). (C) One-step growth-curve assays were performed with wild-type and wild-type-var viruses. Averaged results are from three experiments performed as described in the legend for Fig. 4. (D) Identical Southern blots of modified Hirt DNA extracts from wild-type- or wild-type-var-infected cells were probed with radiolabeled oligonucleotides, as for panel A above, specific for the relative viruses, as indicated above the autoradiograph. The major single- and double-stranded viral DNA species are indicated.
FIG. 8.
FIG. 8.
Relative fitness of each mutant virus in A9 (A) and 324K cells (B). Cells were simultaneously infected with wild-type-var virus and either 6-between, wild-type, 4-between, no-T, or no-cre pChopII-derived viruses, each at a multiplicity of 1,000 genomes per cell. Virus produced by each infection was used to infect new cells for an additional round of competition, as described in Materials and Methods. Average results from three experiments are given and are expressed as the percentage of mutant virus present in the total amount of virus detected in the sample. Each round of infection is represented by a bar of increasing shading, and the input prior to the first round of competition is represented by an unfilled bar. Error bars indicate one standard deviation from the mean.

Similar articles

Cited by

References

    1. Astell, C. R., M. B. Chow, and D. C. Ward. 1985. Sequence analysis of the termini of virion and replicative forms of minute virus of mice DNA suggests a modified rolling hairpin model for autonomous parvovirus DNA replication. J. Virol. 54:171-177. - PMC - PubMed
    1. Astell, C. R., E. M. Gardiner, and P. Tattersall. 1986. DNA sequence of the lymphotropic variant of minute virus of mice, MVM(i), and comparison with the DNA sequence of the fibrotropic prototype strain. J. Virol. 57:656-669. - PMC - PubMed
    1. Astell, C. R., M. Thomson, M. B. Chow, and D. C. Ward. 1983. Structure and replication of minute virus of mice DNA. Cold Spring Harbor Symp. Quant. Biol. 47:751-762. - PubMed
    1. Ball-Goodrich, L. J., R. D. Moir, and P. Tattersall. 1991. Parvoviral target cell specificity: acquisition of fibrotropism by a mutant of the lymphotropic strain of minute virus of mice involves multiple amino acid substitutions within the capsid. Virology 184:175-186. - PubMed
    1. Benbrook, D. M., and N. C. Jones. 1994. Different binding specificities and transactivation of variant CRE's by CREB complexes. Nucleic Acids Res. 22:1463-1469. - PMC - PubMed

Publication types

LinkOut - more resources