

The computational analysis of scientific literature to define and recognize gene expression clusters
- PMID: 12888516
- PMCID: PMC169898
- DOI: 10.1093/nar/gkg636
The computational analysis of scientific literature to define and recognize gene expression clusters
Abstract
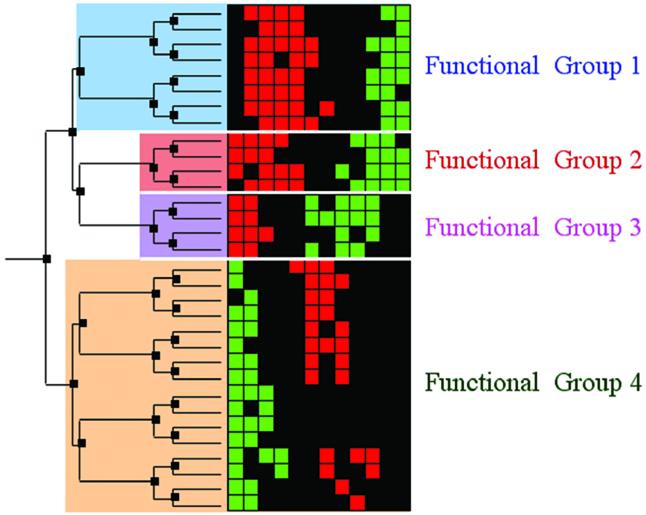
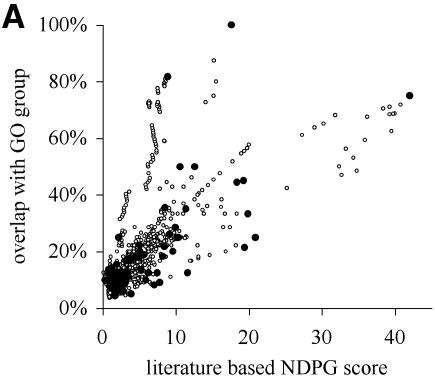
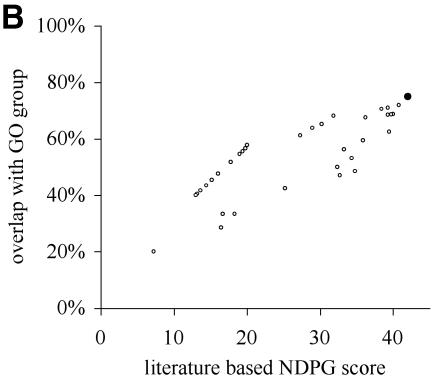
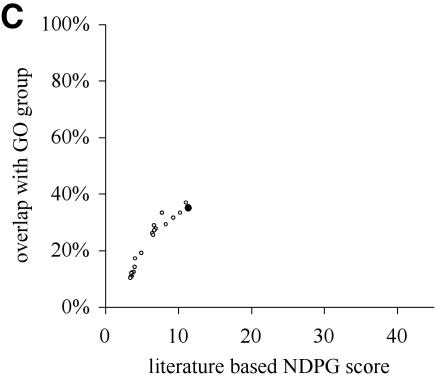
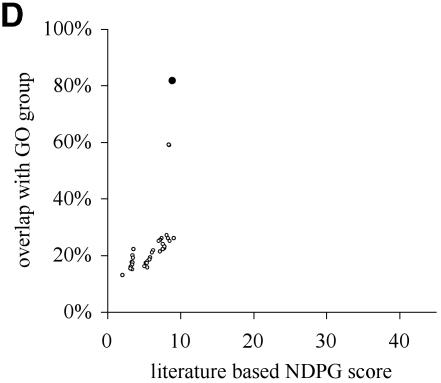
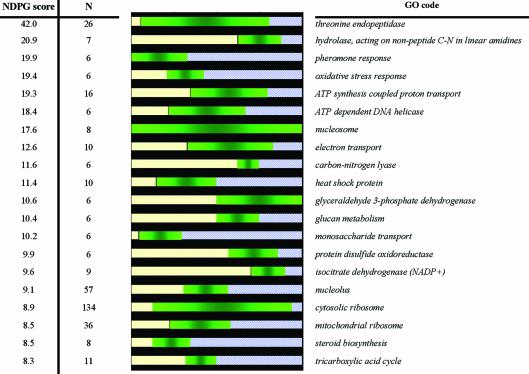
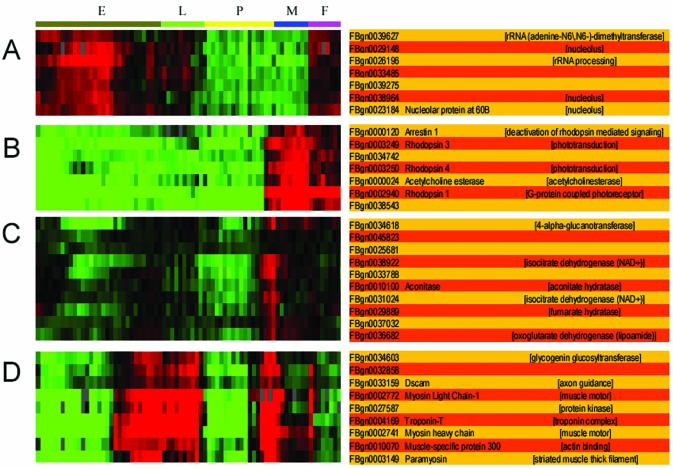
A limitation of many gene expression analytic approaches is that they do not incorporate comprehensive background knowledge about the genes into the analysis. We present a computational method that leverages the peer-reviewed literature in the automatic analysis of gene expression data sets. Including the literature in the analysis of gene expression data offers an opportunity to incorporate functional information about the genes when defining expression clusters. We have created a method that associates gene expression profiles with known biological functions. Our method has two steps. First, we apply hierarchical clustering to the given gene expression data set. Secondly, we use text from abstracts about genes to (i) resolve hierarchical cluster boundaries to optimize the functional coherence of the clusters and (ii) recognize those clusters that are most functionally coherent. In the case where a gene has not been investigated and therefore lacks primary literature, articles about well-studied homologous genes are added as references. We apply our method to two large gene expression data sets with different properties. The first contains measurements for a subset of well-studied Saccharomyces cerevisiae genes with multiple literature references, and the second contains newly discovered genes in Drosophila melanogaster; many have no literature references at all. In both cases, we are able to rapidly define and identify the biologically relevant gene expression profiles without manual intervention. In both cases, we identified novel clusters that were not noted by the original investigators.
Figures
Similar articles
-
Using text analysis to identify functionally coherent gene groups.Genome Res. 2002 Oct;12(10):1582-90. doi: 10.1101/gr.116402. Genome Res. 2002. PMID: 12368251 Free PMC article.
-
Knowledge-assisted recognition of cluster boundaries in gene expression data.Artif Intell Med. 2005 Sep-Oct;35(1-2):171-83. doi: 10.1016/j.artmed.2005.02.007. Artif Intell Med. 2005. PMID: 16054350
-
Selection of informative clusters from hierarchical cluster tree with gene classes.BMC Bioinformatics. 2004 Mar 25;5:32. doi: 10.1186/1471-2105-5-32. BMC Bioinformatics. 2004. PMID: 15043761 Free PMC article.
-
Beyond synexpression relationships: local clustering of time-shifted and inverted gene expression profiles identifies new, biologically relevant interactions.J Mol Biol. 2001 Dec 14;314(5):1053-66. doi: 10.1006/jmbi.2000.5219. J Mol Biol. 2001. PMID: 11743722
-
Computational methods for protein function analysis.Curr Opin Chem Biol. 2001 Feb;5(1):46-50. doi: 10.1016/s1367-5931(00)00165-4. Curr Opin Chem Biol. 2001. PMID: 11166647 Review.
Cited by
-
Complexity in cancer biology: is systems biology the answer?Cancer Med. 2013 Apr;2(2):164-77. doi: 10.1002/cam4.62. Epub 2013 Feb 17. Cancer Med. 2013. PMID: 23634284 Free PMC article. Review.
-
The impact of the NIH public access policy on literature informatics: What role can the neuroinformaticists play?Neuroinformatics. 2005;3(2):81-91. doi: 10.1385/NI:3:2:081. Neuroinformatics. 2005. PMID: 15988039 Review. No abstract available.
-
TXTGate: profiling gene groups with text-based information.Genome Biol. 2004;5(6):R43. doi: 10.1186/gb-2004-5-6-r43. Epub 2004 May 28. Genome Biol. 2004. PMID: 15186494 Free PMC article.
-
Evading the annotation bottleneck: using sequence similarity to search non-sequence gene data.BMC Bioinformatics. 2008 Oct 17;9:442. doi: 10.1186/1471-2105-9-442. BMC Bioinformatics. 2008. PMID: 18928517 Free PMC article.
-
Text-derived concept profiles support assessment of DNA microarray data for acute myeloid leukemia and for androgen receptor stimulation.BMC Bioinformatics. 2007 Jan 18;8:14. doi: 10.1186/1471-2105-8-14. BMC Bioinformatics. 2007. PMID: 17233900 Free PMC article.
References
-
- Alizadeh A.A., Eisen,M.B., Davis,R.E., Ma,C., Lossos,I.S., Rosenwald,A., Boldrick,J.C., Sabet,H., Tran,T. and Yu,X. (2000) Distinct types of diffuse large B-cell lymphoma identified by gene expression profiling. Nature, 403, 503–511. - PubMed
-
- Bittner M., Meltzer,P., Chen,Y., Jiang,Y., Seftor,E., Hendrix,M., Radmacher,M., Simon,R., Yakhini,Z., Ben-Dor,A. et al. (2000) Molecular classification of cutaneous malignant melanoma by gene expression profiling. Nature, 406, 536–540. - PubMed
-
- Golub T.R., Slonim,D.K., Tamayo,P., Huard,C., Gaasenbeek,M., Mesirov,J.P., Coller,H., Loh,M.L., Downing,J.R., Caligiuri,M.A. et al. (1999) Molecular classification of cancer: class discovery and class prediction by gene expression monitoring. Science, 286, 531–537. - PubMed
-
- Arbeitman M.N., Furlong,E.E., Imam,F., Johnson,E., Null,B.H., Baker,B.S., Krasnow,M.A., Scott,M.P., Davis,R.W. and White,K.P. (2002) Gene expression during the life cycle of Drosophila melanogaster. Science, 297, 2270–2275. - PubMed
Publication types
MeSH terms
Substances
Grants and funding
LinkOut - more resources
Full Text Sources
Molecular Biology Databases
