. 2003 Aug 1;31(15):4582-96.
doi: 10.1093/nar/gkg646.

The ERV-9 LTR enhancer is not blocked by the HS5 insulator and synthesizes through the HS5 site non-coding, long RNAs that regulate LTR enhancer function

Affiliations

The ERV-9 LTR enhancer is not blocked by the HS5 insulator and synthesizes through the HS5 site non-coding, long RNAs that regulate LTR enhancer function

Jianhua Ling et al. Nucleic Acids Res. .

Abstract

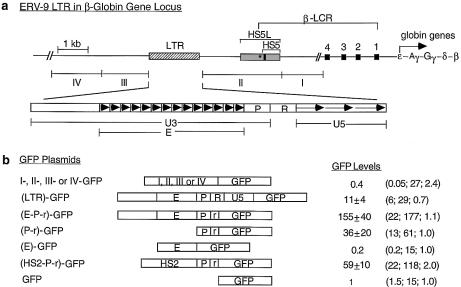
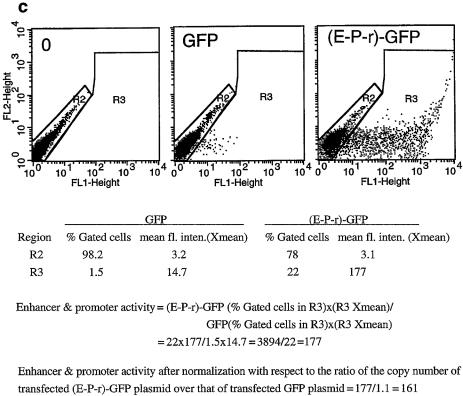
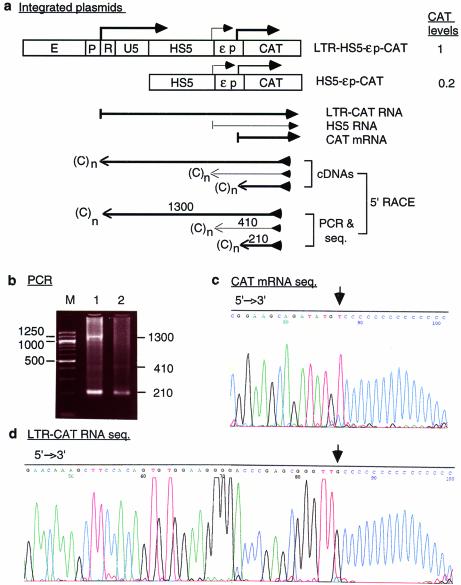
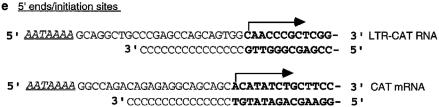
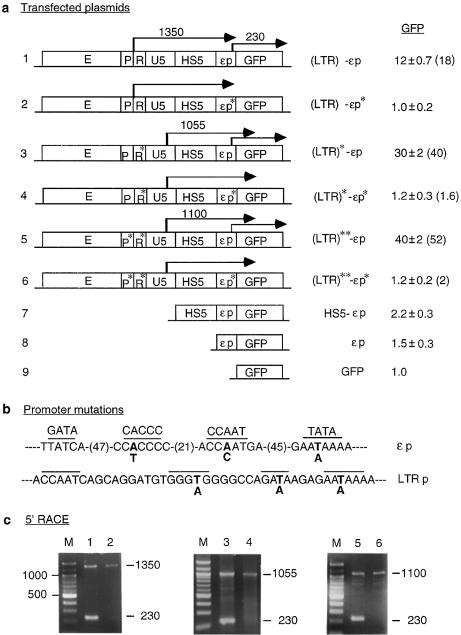
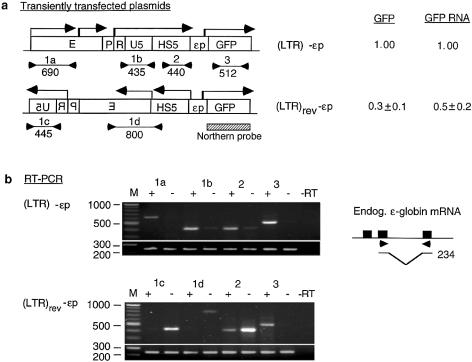
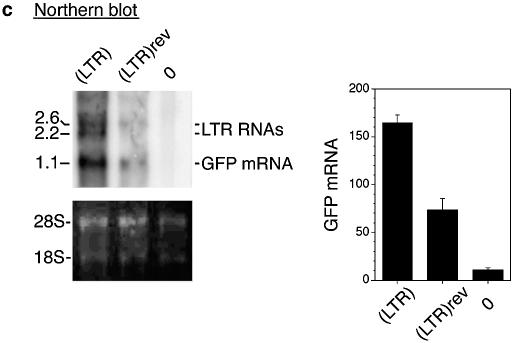
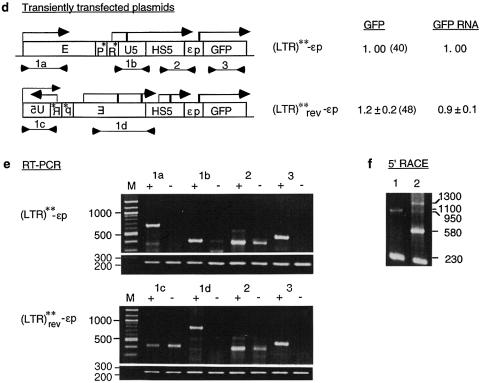
A solitary long terminal repeat (LTR) of ERV-9 human endogenous retrovirus is located upstream of the HS5 site in the human beta-globin locus control region and possesses unique enhancer activity in erythroid K562 cells. In cells transfected with plasmid LTR-HS5-epsilonp-GFP, the LTR enhancer activates the GFP reporter gene and is not blocked by the interposed HS5 site, which has been reported to have insulator function. The LTR enhancer initiates synthesis of long RNAs from the LTR promoter through the intervening HS5 site into the epsilon-globin promoter and the GFP gene. Synthesis of the sense, long LTR RNAs is correlated with high level synthesis of GFP mRNA from the epsilon-globin promoter. Mutations of the LTR promoter and/or the epsilon-globin promoter show that (i) the LTR enhancer can autonomously initiate synthesis of LTR RNAs independent of the promoters and (ii) the LTR RNAs are not processed into GFP mRNA or translated into GFP. However, reversing the orientation of the LTR in plasmid (LTR)rev-HS5-epsilonp-GFP, thus reversing the direction of synthesis of LTR RNAs in the antisense direction away from the epsilon-globin promoter and GFP gene drastically reduces the level of GFP mRNA and thus LTR enhancer function. The results suggest that the LTR-assembled transcription machinery in synthesizing non-coding, LTR RNAs can reach the downstream epsilon-globin promoter to activate transcription of the GFP gene.


Figures

Figure 1
Figure 1
(Opposite) Structural and functional analyses of the 5′ boundary area of the human β-LCR. (a) Map of the ERV-9 LTR and the 5′ boundary area of the human β-LCR. Hatched box, LTR; stippled box, HS5L, the 1.2 kb HS5 site; vertical bar, CTCF binding site; *, NF-E2 binding site; HS5, the 0.5 kb HS5 site (see Table 1 for constructs containing HS5L or HS5); solid boxes, DNase I hypersensitive sites HS4, HS3, HS2 and HS1 of the β-LCR. The 9 kb DNA between // signs is drawn to scale; the 65 kb DNA to the right of // spans the β-LCR and the human β-like globin genes and is not drawn to scale. DNA fragments I, II, III and IV, DNAs in the boundary area that flank the LTR. The LTR is enlarged to show the U3, R and U5 regions. E, the U3 enhancer spanning 14 tandem repeats of 40 bp each denoted by the arrowheads; P, the 90 bp U3 promoter; open box to the left of E, the 590 bp of U3 GC-rich DNA 5′ of the enhancer; horizontal arrows, the three tandem repeats of ∼80 bp each in U5. (b) Maps of the recombinant GFP plasmids containing subfragments of the 5′ boundary area, I-, II-, III- and IV-, the LTR and components of the LTR. (HS2-P-r)-GFP contained the HS2 enhancer, the U3 promoter and the 5′ half of the R region of the 5′HS5 LTR coupled to the GFP gene. GFP, the reference enhancerless and promoterless GFP plasmid. The third column gives the GFP levels of the test plasmids relative to that of the reference GFP plasmid in transfected cells; values are averages of two determinations. For the I-, II-, III- and IV-GFP plasmids, the representative values of the III-GFP plasmid are presented; the GFP levels of the I-, II- and IV-GFP plasmids were even lower, in the 0.2–0.4 range, and are not shown. The three numbers in parentheses are, respectively, the percentage of fluorescent cells, the mean fluorescence intensities of the fluorescent cells [see (c)] and the ratio of the plasmid copy number of the transfected test plasmid to that of the reference GFP plasmid. (c) Sample calculation of the enhancer/promoter activity of the transfected (E-P-r)-GFP plasmid. (Left, middle and right) Dot plots by FACS analyses of K562 cells transfected with Tris buffer and GFP and (E-P-r)-GFP plasmids, respectively. x-axis, GFP fluorescence intensities of the transfected cells; y-axis, FL2 channel. The dot plots are the same whether FL2 or side scatter was used as the y-axis in the Cellquest program. However, using FL2 as the y-axis produced more compact and thus more easily gated fluorescent and non-fluorescent cell populations. R2 region, non-fluorescent cells; R3 region, fluorescent cells. The table below the dot plots gives quantitative analysis by the Cellquest program of the dot plot data. Xmean, mean fluorescence intensities of the gated cells. (Bottom) Calculation of the enhancer/promoter activity of (E-P-r)-GFP in K562 cells.
Figure 1
Figure 1
(Opposite) Structural and functional analyses of the 5′ boundary area of the human β-LCR. (a) Map of the ERV-9 LTR and the 5′ boundary area of the human β-LCR. Hatched box, LTR; stippled box, HS5L, the 1.2 kb HS5 site; vertical bar, CTCF binding site; *, NF-E2 binding site; HS5, the 0.5 kb HS5 site (see Table 1 for constructs containing HS5L or HS5); solid boxes, DNase I hypersensitive sites HS4, HS3, HS2 and HS1 of the β-LCR. The 9 kb DNA between // signs is drawn to scale; the 65 kb DNA to the right of // spans the β-LCR and the human β-like globin genes and is not drawn to scale. DNA fragments I, II, III and IV, DNAs in the boundary area that flank the LTR. The LTR is enlarged to show the U3, R and U5 regions. E, the U3 enhancer spanning 14 tandem repeats of 40 bp each denoted by the arrowheads; P, the 90 bp U3 promoter; open box to the left of E, the 590 bp of U3 GC-rich DNA 5′ of the enhancer; horizontal arrows, the three tandem repeats of ∼80 bp each in U5. (b) Maps of the recombinant GFP plasmids containing subfragments of the 5′ boundary area, I-, II-, III- and IV-, the LTR and components of the LTR. (HS2-P-r)-GFP contained the HS2 enhancer, the U3 promoter and the 5′ half of the R region of the 5′HS5 LTR coupled to the GFP gene. GFP, the reference enhancerless and promoterless GFP plasmid. The third column gives the GFP levels of the test plasmids relative to that of the reference GFP plasmid in transfected cells; values are averages of two determinations. For the I-, II-, III- and IV-GFP plasmids, the representative values of the III-GFP plasmid are presented; the GFP levels of the I-, II- and IV-GFP plasmids were even lower, in the 0.2–0.4 range, and are not shown. The three numbers in parentheses are, respectively, the percentage of fluorescent cells, the mean fluorescence intensities of the fluorescent cells [see (c)] and the ratio of the plasmid copy number of the transfected test plasmid to that of the reference GFP plasmid. (c) Sample calculation of the enhancer/promoter activity of the transfected (E-P-r)-GFP plasmid. (Left, middle and right) Dot plots by FACS analyses of K562 cells transfected with Tris buffer and GFP and (E-P-r)-GFP plasmids, respectively. x-axis, GFP fluorescence intensities of the transfected cells; y-axis, FL2 channel. The dot plots are the same whether FL2 or side scatter was used as the y-axis in the Cellquest program. However, using FL2 as the y-axis produced more compact and thus more easily gated fluorescent and non-fluorescent cell populations. R2 region, non-fluorescent cells; R3 region, fluorescent cells. The table below the dot plots gives quantitative analysis by the Cellquest program of the dot plot data. Xmean, mean fluorescence intensities of the gated cells. (Bottom) Calculation of the enhancer/promoter activity of (E-P-r)-GFP in K562 cells.
Figure 2
Figure 2
(Opposite) Transcription of integrated plasmid LTR-HS5-εp-CAT in K562 cells. (a) Maps of the integrated LTR-HS5-εp-CAT and HS5-εp-CAT plasmids and transcription of the plasmids analyzed by 5′-RACE. Angled arrows, locations of transcriptional initiation sites in the LTR, HS5 site and the ε-globin promoter. Left to right arrows, RNAs initiated from within the LTR, HS5 and ε-globin promoter, with the thickness of the arrows showing the relative abundance of the RNAs. Right to left arrows, cDNAs reverse transcribed from the respective RNAs and PCR fragments subsequently amplified from the cDNAs by the 5′-RACE protocol. The PCR fragments depicted were the sequenced DNA strand; the arrows are aligned with the plasmid map on top. (C)n, poly(dC) tails added to the 3′ end of the cDNAs by the TdT enzyme. The arrowheads at the 5′ ends of the cDNA or the PCR fragment indicate the reverse primers used for cDNA synthesis, PCR amplification and DNA sequencing. Numbers are the sizes in nucleotides of the PCR fragments determined by gel electrophoresis and DNA sequencing [see (b), (c) and (d)]. CAT levels are relative levels of CAT enzyme produced by the LTR-HS5-εp-CAT plasmid (at 8 copies/cell) and HS5-εp-CAT (at 14 copies/cell) determined previously by CAT assay (19). (b) PCR products of 5′-RACE. Lanes 1 and 2, PCR bands generated by RNAs transcribed, respectively, from the LTR-HS5-εp-CAT and HS5-εp-CAT plasmids; M, 100 bp size markers. Numbers on the right and left margins are sizes in bp of the PCR fragments and the size markers. (c) DNA seqence of the 210 bp PCR fragment generated from CAT mRNA. The base marked by the arrow is the 5′ end/initiation site of CAT mRNA. (d) DNA sequence of the 1300 bp PCR fragment generated from the long LTR RNA; only the 5′ end of the sequence is shown. Arrow, 5′ end/initiation site of the LTR RNA. (e) DNA sequences near the transcriptional initiation sites of the LTR RNA and CAT mRNA. AATAAA, TATA box in the U3 or the ε-globin promoter; angled arrows, locations of transcriptional initiation sites; bold bases, transcribed bases.
Figure 2
Figure 2
(Opposite) Transcription of integrated plasmid LTR-HS5-εp-CAT in K562 cells. (a) Maps of the integrated LTR-HS5-εp-CAT and HS5-εp-CAT plasmids and transcription of the plasmids analyzed by 5′-RACE. Angled arrows, locations of transcriptional initiation sites in the LTR, HS5 site and the ε-globin promoter. Left to right arrows, RNAs initiated from within the LTR, HS5 and ε-globin promoter, with the thickness of the arrows showing the relative abundance of the RNAs. Right to left arrows, cDNAs reverse transcribed from the respective RNAs and PCR fragments subsequently amplified from the cDNAs by the 5′-RACE protocol. The PCR fragments depicted were the sequenced DNA strand; the arrows are aligned with the plasmid map on top. (C)n, poly(dC) tails added to the 3′ end of the cDNAs by the TdT enzyme. The arrowheads at the 5′ ends of the cDNA or the PCR fragment indicate the reverse primers used for cDNA synthesis, PCR amplification and DNA sequencing. Numbers are the sizes in nucleotides of the PCR fragments determined by gel electrophoresis and DNA sequencing [see (b), (c) and (d)]. CAT levels are relative levels of CAT enzyme produced by the LTR-HS5-εp-CAT plasmid (at 8 copies/cell) and HS5-εp-CAT (at 14 copies/cell) determined previously by CAT assay (19). (b) PCR products of 5′-RACE. Lanes 1 and 2, PCR bands generated by RNAs transcribed, respectively, from the LTR-HS5-εp-CAT and HS5-εp-CAT plasmids; M, 100 bp size markers. Numbers on the right and left margins are sizes in bp of the PCR fragments and the size markers. (c) DNA seqence of the 210 bp PCR fragment generated from CAT mRNA. The base marked by the arrow is the 5′ end/initiation site of CAT mRNA. (d) DNA sequence of the 1300 bp PCR fragment generated from the long LTR RNA; only the 5′ end of the sequence is shown. Arrow, 5′ end/initiation site of the LTR RNA. (e) DNA sequences near the transcriptional initiation sites of the LTR RNA and CAT mRNA. AATAAA, TATA box in the U3 or the ε-globin promoter; angled arrows, locations of transcriptional initiation sites; bold bases, transcribed bases.
Figure 3
Figure 3
Effects of mutations in the LTR and the ε-globin promoters on transcription of LTR RNAs and GFP expression. (a) Maps of plasmids containing promoter mutations. P*, R* and εp*, mutated LTR promoter, R region and ε-globin promoter (see Materials and Methods and Fig. 3b). (LTR)* and (LTR)**, the LTR containing mutations in only the R region and in both the R region and LTR promoter, respectively. Angled arrows, LTR initiated long RNAs and GFP mRNA, with locations of the angled arrows marking transcription initiation sites mapped by 5′-RACE; the numbers above the arrows are the sizes in nucleotides of the 5′-RACE bands. Numbers in the column under GFP are GFP levels of transiently transfected plasmids expressed with respect to the GFP level of the enhancerless and promoterless GFP plasmid; the values are averages of two transfection experiments. Numbers in parentheses are GFP levels of integrated plasmids. Other designations are as in Figure 2a. (b) Mutations in the ε-globin and LTR promoters. Overlined bases, sequence motifs important to the function of the respective promoters. Bold letters, DNA bases in the promoters that were mutated to the bases below. In the ε-globin promoter, numbers in parentheses are the number of bases between the overlined motifs. (c) 5′-RACE. Lanes 1–6, 5′-RACE bands generated by RNAs transcribed from the transfected constructs 1–6; numbers on the right margins are sizes in bp of the 5′-RACE bands.
Figure 4
Figure 4
(Opposite and above) Effects of LTR orientation on GFP mRNA synthesis and GFP expression. (a) Maps of the reference (LTR)-εp and test (LTR)rev-εp plasmids. Locations and direction of angled arrows show the locations of RNA initiation sites and direction of RNA synthesis. The locations marked by heavy stems are initiation sites mapped by 5′-RACE and northern blot; locations marked by thin stems are initiation sites postulated to exist from the RT–PCR bands. Horizontal lines marked 1a, 1b, 1c, 1d, 2 and 3 are RT–PCR products generated by the respective primer pairs 1a–1d, 2 and 3; the lines are aligned with the plasmid maps on top; numbers underneath the lines are sizes (bp) of the RT–PCR bands. Hatched box, northern blot probe. GFP and GFP RNA, levels of GFP expression and GFP RNA of the test relative to those of the reference plasmids. Numbers in parentheses are GFP levels of the plasmids relative to that of the enhancerless and promoterless GFP plasmid. (b) Directional RT–PCR. Lanes marked 1a–1d, 2 and 3 are RT–PCR bands generated by the respective primer pairs; + and – lanes, RT–PCR bands generated by each primer pair from the sense and the antisense RNAs; –RT lane, no reverse transcriptase in the RT step to show absence of DNA contamination in the RNA samples; bottom rows of RT–PCR bands were generated from the endogenous ε-globin mRNA with a primer pair as depicted in the inset to its right and served as internal controls. (Inset) Solid boxes, the three exons of the ε-globin gene; arrowheads, the location of the primer pair spanning the second intron; horizontal lines, the spliced ε-globin mRNA amplified by the primer pair; the bent line, spliced out second intron; number to the right, size in base pairs of the RT–PCR band amplified by the primer pair from the ε-globin mRNA. (c) Northern blot of total cellular RNAs isolated from K562 cells transfected with (LTR)-εp plasmid [lane (LTR)], (LTR)rev-εp plasmid [lane (LTR)rev] and a non-transfected K562 control (lane 0). (Top left) Northern blot hybridized to the GFP gene probe. Numbers in the left margin are sizes in kilobases of the LTR RNAs and GFP mRNA. (Bottom left) Ethidium bromide stained bands of 28S and 18S RNAs to show equal loading of the RNA samples in different lanes in the agarose gel. Bar graphs are mean values of the radioactive counts, measured in arbitrary pixel units, of GFP mRNA from blots of three separate RNA preparations. (d and e) Maps of reference (LTR)**-εp and test (LTR)**rev-εp plasmids. Designations as in (a) and (b). (f) 5′-RACE of LTR RNAs and GFP mRNA transcribed from (LTR)**-εp (lane 1) and (LTR)**rev-εp (lane 2).
Figure 4
Figure 4
(Opposite and above) Effects of LTR orientation on GFP mRNA synthesis and GFP expression. (a) Maps of the reference (LTR)-εp and test (LTR)rev-εp plasmids. Locations and direction of angled arrows show the locations of RNA initiation sites and direction of RNA synthesis. The locations marked by heavy stems are initiation sites mapped by 5′-RACE and northern blot; locations marked by thin stems are initiation sites postulated to exist from the RT–PCR bands. Horizontal lines marked 1a, 1b, 1c, 1d, 2 and 3 are RT–PCR products generated by the respective primer pairs 1a–1d, 2 and 3; the lines are aligned with the plasmid maps on top; numbers underneath the lines are sizes (bp) of the RT–PCR bands. Hatched box, northern blot probe. GFP and GFP RNA, levels of GFP expression and GFP RNA of the test relative to those of the reference plasmids. Numbers in parentheses are GFP levels of the plasmids relative to that of the enhancerless and promoterless GFP plasmid. (b) Directional RT–PCR. Lanes marked 1a–1d, 2 and 3 are RT–PCR bands generated by the respective primer pairs; + and – lanes, RT–PCR bands generated by each primer pair from the sense and the antisense RNAs; –RT lane, no reverse transcriptase in the RT step to show absence of DNA contamination in the RNA samples; bottom rows of RT–PCR bands were generated from the endogenous ε-globin mRNA with a primer pair as depicted in the inset to its right and served as internal controls. (Inset) Solid boxes, the three exons of the ε-globin gene; arrowheads, the location of the primer pair spanning the second intron; horizontal lines, the spliced ε-globin mRNA amplified by the primer pair; the bent line, spliced out second intron; number to the right, size in base pairs of the RT–PCR band amplified by the primer pair from the ε-globin mRNA. (c) Northern blot of total cellular RNAs isolated from K562 cells transfected with (LTR)-εp plasmid [lane (LTR)], (LTR)rev-εp plasmid [lane (LTR)rev] and a non-transfected K562 control (lane 0). (Top left) Northern blot hybridized to the GFP gene probe. Numbers in the left margin are sizes in kilobases of the LTR RNAs and GFP mRNA. (Bottom left) Ethidium bromide stained bands of 28S and 18S RNAs to show equal loading of the RNA samples in different lanes in the agarose gel. Bar graphs are mean values of the radioactive counts, measured in arbitrary pixel units, of GFP mRNA from blots of three separate RNA preparations. (d and e) Maps of reference (LTR)**-εp and test (LTR)**rev-εp plasmids. Designations as in (a) and (b). (f) 5′-RACE of LTR RNAs and GFP mRNA transcribed from (LTR)**-εp (lane 1) and (LTR)**rev-εp (lane 2).

Similar articles

Cited by

References

    1. Wilkison D., Mager,D. and Leong,J. (1994) Endogenous human retroviruses. In Levy,J. (ed.), The Retroviridae. Plenum Press, New York, NY, Vol. 3, pp. 465–535.
    1. Smit A.F. (1996) The origin of interspersed repeats in the human genome. Curr. Opin. Genet. Dev., 6, 743–748. - PubMed
    1. Lower R., Lower,J. and Kurth,R. (1996) The viruses in all of us: characteristics and biological significance of human endogenous retrovirus sequences. Proc. Natl Acad. Sci. USA, 93, 5177–5184. - PMC - PubMed
    1. Henikoff S., Greene,E., Pietrokovski,S., Bork,P., Attwood,T. and Hood,L. (1997) Gene families: the taxonomy of protein paralogs and chimeras. Science, 278, 609–614. - PubMed
    1. Temin H.M. (1981) Structure, variation and synthesis of retrovirus long terminal repeat. Cell, 27, 1–3. - PubMed

Publication types

MeSH terms

Associated data