

Controlling nucleic acid secondary structure by intercalation: effects of DNA strand length on coralyne-driven duplex disproportionation
- PMID: 12888521
- PMCID: PMC169941
- DOI: 10.1093/nar/gkg648
Controlling nucleic acid secondary structure by intercalation: effects of DNA strand length on coralyne-driven duplex disproportionation
Abstract
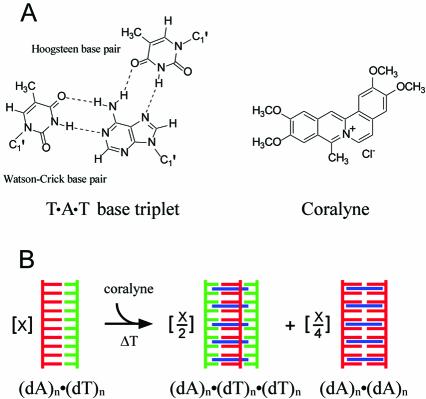
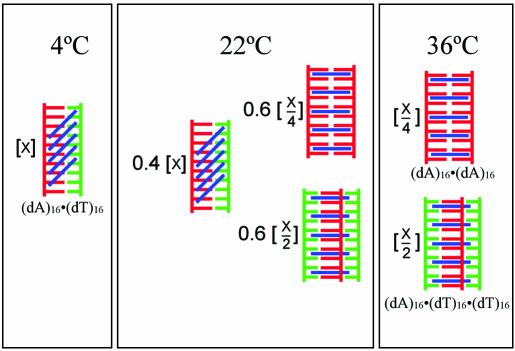
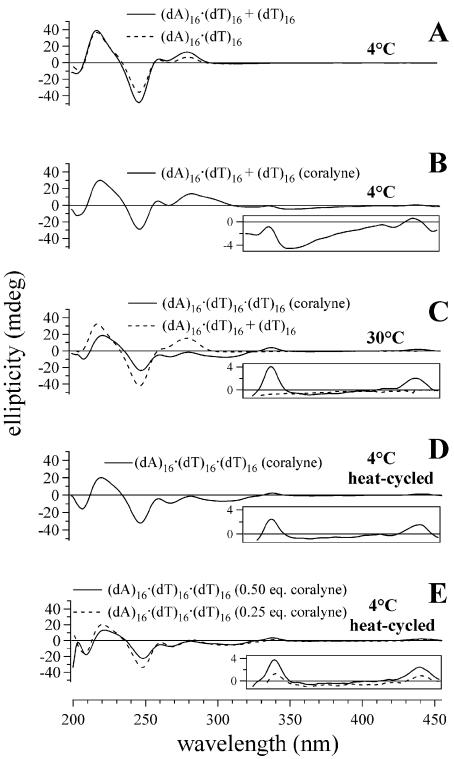
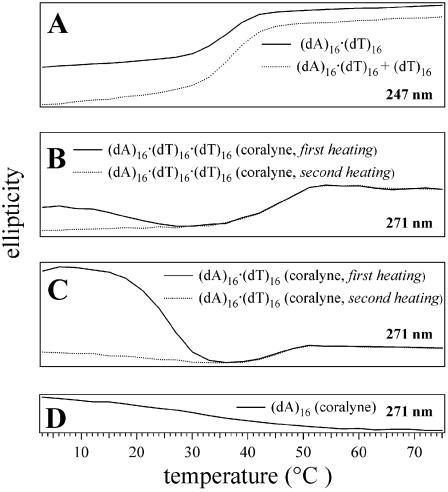
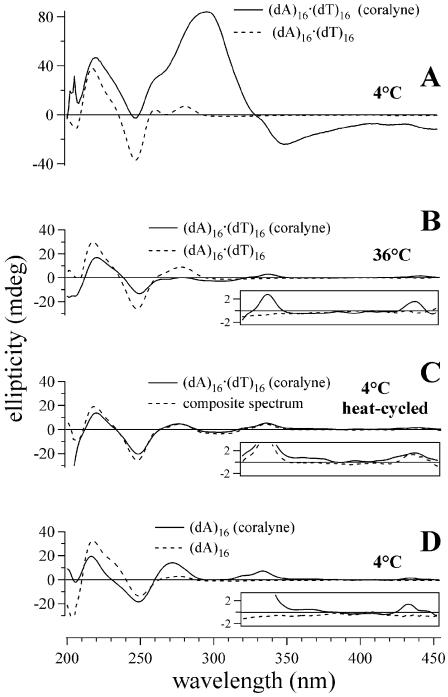
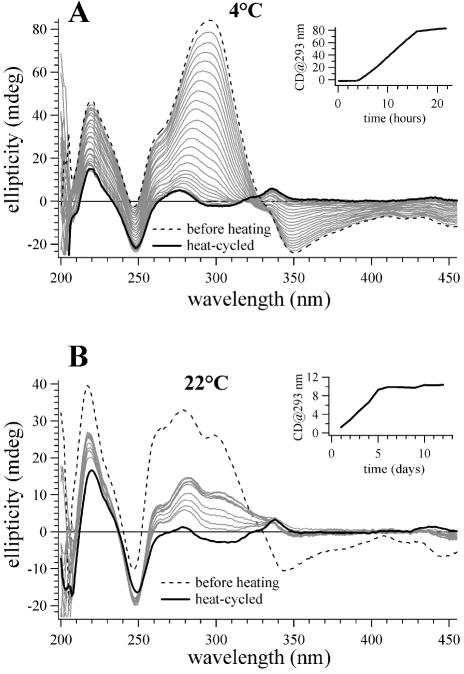
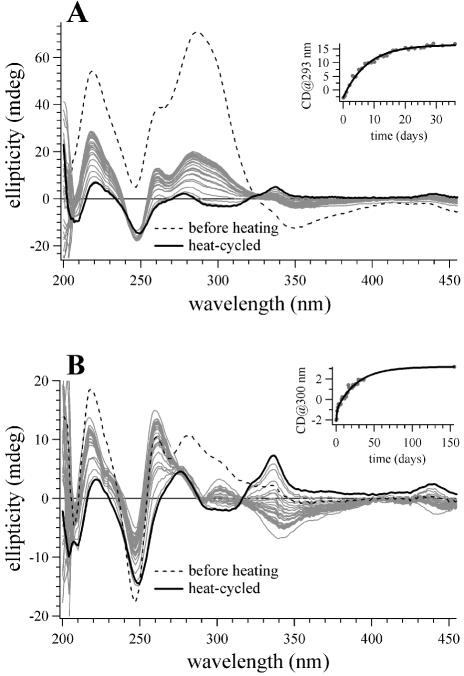
Small molecules that intercalate in DNA and RNA are powerful agents for controlling nucleic acid structural transitions. We recently demonstrated that coralyne, a small crescent-shaped molecule, can cause the complete and irreversible disproportionation of duplex poly(dA)*poly(dT) into triplex poly(dA)*poly(dT)*poly(dT) and a poly(dA) self-structure. Both DNA secondary structures that result from duplex disproportionation are stabilized by coralyne intercalation. In the present study, we show that the kinetics and thermodynamics of coralyne-driven duplex disproportionation strongly depend on oligonucleotide length. For example, disproportionation of duplex (dA)16*(dT)16 by coralyne reverts over the course of hours if the sample is maintained at 4 degrees C. Coralyne-disproportioned (dA)32. (dT)(32), on the other hand, only partially reverts to the duplex state over the course of days at the same temperature. Furthermore, the equilibrium state of a (dA)16*(dT)16 sample in the presence of coralyne at room temperature contains three different secondary structures [i.e. duplex, triplex and the (dA)16 self-structure]. Even the well-studied process of triplex stabilization by coralyne binding is found to be a length-dependent phenomenon and more complicated than previously appreciated. Together these observations indicate that at least one secondary structure in our nucleic acid system [i.e. duplex, triplex or (dA)n self-structure] binds coralyne in a length-dependent manner.
Figures
Similar articles
-
Complete disproportionation of duplex poly(dT)*poly(dA) into triplex poly(dT)*poly(dA)*poly(dT) and poly(dA) by coralyne.Nucleic Acids Res. 2002 Feb 15;30(4):983-92. doi: 10.1093/nar/30.4.983. Nucleic Acids Res. 2002. PMID: 11842110 Free PMC article.
-
The binding of analogues of coralyne and related heterocyclics to DNA triplexes.Biochem Cell Biol. 1995 Jan-Feb;73(1-2):11-8. doi: 10.1139/o95-002. Biochem Cell Biol. 1995. PMID: 7662309
-
New aspects of the interaction of the antibiotic coralyne with RNA: coralyne induces triple helix formation in poly(rA)*poly(rU).Nucleic Acids Res. 2010 Mar;38(5):1697-710. doi: 10.1093/nar/gkp1146. Epub 2009 Dec 14. Nucleic Acids Res. 2010. PMID: 20008509 Free PMC article.
-
The interaction of intercalators and groove-binding agents with DNA triple-helical structures: the influence of ligand structure, DNA backbone modifications and sequence.J Mol Recognit. 1994 Jun;7(2):89-98. doi: 10.1002/jmr.300070206. J Mol Recognit. 1994. PMID: 7826678 Review.
-
The influence of intercalator binding on DNA triplex stability: correlation with effects on A-tract duplex structure.J Mol Recognit. 2004 Jul-Aug;17(4):277-85. doi: 10.1002/jmr.665. J Mol Recognit. 2004. PMID: 15227636 Review.
Cited by
-
Nanopharmaceutical Approach for Enhanced Anti-cancer Activity of Betulinic Acid in Lung-cancer Treatment via Activation of PARP: Interaction with DNA as a Target: -Anti-cancer Potential of Nano-betulinic Acid in Lung Cancer.J Pharmacopuncture. 2016 Mar;19(1):37-44. doi: 10.3831/KPI.2016.19.005. J Pharmacopuncture. 2016. PMID: 27280048 Free PMC article.
-
Modulation of DNA structure formation using small molecules.Biochim Biophys Acta Mol Cell Res. 2019 Dec;1866(12):118539. doi: 10.1016/j.bbamcr.2019.118539. Epub 2019 Sep 3. Biochim Biophys Acta Mol Cell Res. 2019. PMID: 31491448 Free PMC article. Review.
-
Triplex inducer-directed self-assembly of single-walled carbon nanotubes: a triplex DNA-based approach for controlled manipulation of nanostructures.Nucleic Acids Res. 2011 May;39(9):3939-48. doi: 10.1093/nar/gkq1347. Epub 2011 Jan 11. Nucleic Acids Res. 2011. PMID: 21227925 Free PMC article.
-
Intercalation as a means to suppress cyclization and promote polymerization of base-pairing oligonucleotides in a prebiotic world.Proc Natl Acad Sci U S A. 2010 Mar 23;107(12):5288-93. doi: 10.1073/pnas.0914172107. Epub 2010 Mar 8. Proc Natl Acad Sci U S A. 2010. PMID: 20212163 Free PMC article.
-
Synthesis of novel coumarin nucleus-based DPA drug-like molecular entity: In vitro DNA/Cu(II) binding, DNA cleavage and pro-oxidant mechanism for anticancer action.PLoS One. 2017 Aug 1;12(8):e0181783. doi: 10.1371/journal.pone.0181783. eCollection 2017. PLoS One. 2017. PMID: 28763458 Free PMC article.
References
-
- Hurley L.H. (1989) DNA and associated targets for drug design. J. Med. Chem., 32, 2027–2033. - PubMed
-
- Krugh T.R. (1994) Drug-DNA interactions. Curr. Opin. Struct. Biol., 4, 351–364.
-
- Chaires J.B. (1997) Energetics of drug-DNA interactions. Biopolymers, 44, 201–215. - PubMed
-
- Hurley L.H. (2002) DNA and its associated processes as targets for cancer therapy. Nature Rev. Cancer, 2, 188–200. - PubMed
Publication types
MeSH terms
Substances
Grants and funding
LinkOut - more resources
Full Text Sources
Miscellaneous
