. 2003 Jul 30;23(17):6713-27.
doi: 10.1523/JNEUROSCI.23-17-06713.2003.

A two-stage unsupervised learning algorithm reproduces multisensory enhancement in a neural network model of the corticotectal system

Affiliations

A two-stage unsupervised learning algorithm reproduces multisensory enhancement in a neural network model of the corticotectal system

Thomas J Anastasio et al. J Neurosci. .

Abstract

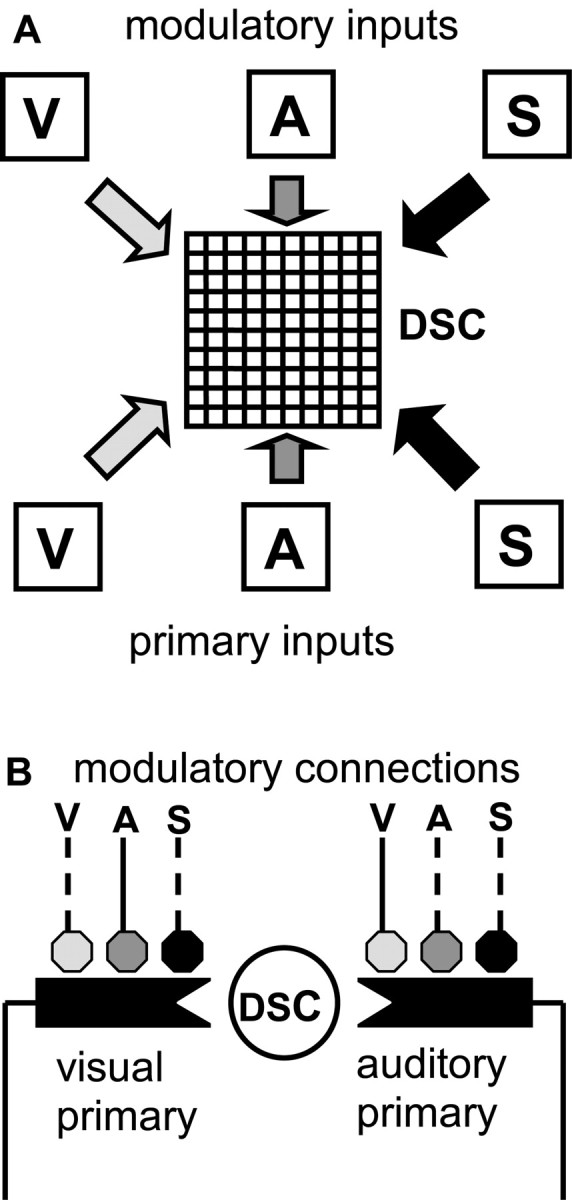
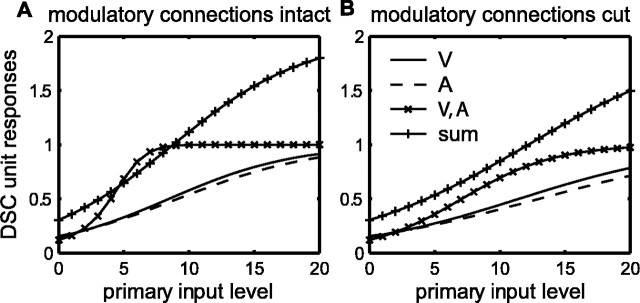
Multisensory enhancement (MSE) is the augmentation of the response to sensory stimulation of one modality by stimulation of a different modality. It has been described for multisensory neurons in the deep superior colliculus (DSC) of mammals, which function to detect, and direct orienting movements toward, the sources of stimulation (targets). MSE would seem to improve the ability of DSC neurons to detect targets, but many mammalian DSC neurons are unimodal. MSE requires descending input to DSC from certain regions of parietal cortex. Paradoxically, the descending projections necessary for MSE originate from unimodal cortical neurons. MSE, and the puzzling findings associated with it, can be simulated using a model of the corticotectal system. In the model, a network of DSC units receives primary sensory input that can be augmented by modulatory cortical input. Connection weights from primary and modulatory inputs are trained in stages one (Hebb) and two (Hebb-anti-Hebb), respectively, of an unsupervised two-stage algorithm. Two-stage training causes DSC units to extract information concerning simulated targets from their inputs. It also causes the DSC to develop a mixture of unimodal and multisensory units. The percentage of DSC multisensory units is determined by the proportion of cross-modal targets and by primary input ambiguity. Multisensory DSC units develop MSE, which depends on unimodal modulatory connections. Removal of the modulatory influence greatly reduces MSE but has little effect on DSC unit responses to stimuli of a single modality. The correspondence between model and data suggests that two-stage training captures important features of self-organization in the real corticotectal system.


Figures

Figure 1.
Figure 1.
Schematic of the corticotectal model that produces multisensory enhancement in the DSC. A, The DSC is represented as a 10 × 10 grid of units. Primary inputs represent unimodal, excitatory projections from the visual (V), auditory (A), or somatosensory (S) systems. Modulatory inputs represent unimodal visual, auditory, or somatosensory projections from parietal cortex. Before stage-one training, each DSC unit receives primary input of all three modalities. Stage-one training causes DSC units to become specialized for specific modalities or modality combinations. As an example, a unit that receives primary input from the visual and auditory systems after stage-one training is shown in B. B, Before stage-two training, each primary connection may potentially receive modulatory input of all three modalities (solid and dashed lines), but stage-two training is restricted by the modality-matching and cross-modality constraints (see Materials and Methods). After stage-two training under these constraints, the unit shown can receive only visual and auditory modulatory input, with the primary visual connection modulated by the auditory modulatory input, and the primary auditory connection modulated by the visual modulatory input (solid lines).
Figure 2.
Figure 2.
Input likelihoods P(r) modeled as binomial distributions b(n, p) (Eq. 1), where r is the number of the n = 20 binary variables that are active. The primary input spontaneous likelihood (solid curve) has activation probability p = px0 = 0.1. The three primary input driven likelihoods have activation probabilities p = px1 of 0.3, 0.6, or 0.9 (dashed, dot-dashed, or dotted curves, respectively). For the modulatory input, the driven likelihood has activation probability p = py1 = 0.1 (solid curve), whereas the spontaneous likelihood has activation probability p = py0 = 0. Thus, a modulatory input of zero has probability one under spontaneous conditions.
Figure 3.
Figure 3.
Stage-one training causes primary weight vectors to cluster with primary input vectors. The distinctiveness of the clusters depends on primary input ambiguity. In A-C, there are twice as many modality-specific as cross-modal targets, and the spontaneous primary input activation probability px0 equals 0.1. The primary input becomes less ambiguous as the driven activation probability px1 is increased from 0.3 (A) to 0.6 (B) to 0.9 (C) (Table 3). Clusters of primary input vectors (circles) become progressively more distinct. This causes more primary weight vectors (plus signs) to adopt a distinctly unimodal pattern. V, Visual; A, auditory; S, somatosensory.
Figure 4.
Figure 4.
The percentage of multisensory DSC units resulting from stage-one training is plotted as a function of primary weight threshold θu and the probability of a modality-specific target ps (where the probability of a cross-modal target pc equals ½ - ps). The spontaneous and driven primary input activation probabilities px0 and px1 are 0.1 and 0.6, respectively. The modality-specific target probability ps is increased from 0 to 0.5 in steps of 0.025, with 10 networks trained for each ps value. The primary weight threshold θu is increased from 0 to 1 in steps of 0.025. Each of the 10 networks are thresholded at each θu value. The percentage of multisensory units shown is the mean for the 10 networks. The percentage of multisensory DSC units falls as θu increases. The fall is more rapid when modality-specific targets are more probable (and cross-modal targets are less probable). Any desired percentage of multisensory DSC units can be obtained through appropriate choice of θu and ps.
Figure 5.
Figure 5.
The abundance of correct modulatory weights resulting from stage-two training depends sensitively on DSC unit threshold θz and on modality-specific target probability ps. In A-C, the spontaneous primary input activation probability px0 equals 0.1. The primary input becomes less ambiguous as driven activation probability px1 is increased from 0.3 (A) to 0.6 (B) to 0.9 (C) (Table 3). The primary input threshold θx is increased from 4 (A) to 6 (B) to 10 (C). In A-C, the modulatory input spontaneous and driven activation probabilities py0 and py1 are 0 and 0.1, respectively, and the modulatory input threshold θy is 0. Modality-specific target probability ps is varied from 0 to 0.5 in steps of 0.025. Ten networks receive stage-one training for 5000 iterations at each ps value. Primary weights are pruned at θu = 0.4. DSC unit activity threshold θz is varied from 0 to 1 in steps of 0.05. Each of the 10 stage-one trained networks, at each ps value, receives stage-two training for 5000 iterations at each θz value. This yields 10 trained networks for each combination of ps and θz. Sets of 10 containing any misdirected modulatory weights (i.e., modulatory weights not respecting the modality-matching and cross-modality constraints) are excluded. For sets of 10 containing no such errors, the mean number of DSC units receiving modulatory connections is computed. Each panel plots the number of units, in error-free networks, that receive modulatory input. For px1 = 0.3 (A) stage-two works best when 0.2 ≤θz ≤ 0.3 and ps ≥ 0.15, for px1 = 0.6 (B) when 0.2 ≤θz ≤ 0.55 and ps ≥ 0.23, and for px1 = 0.9 (C) when 0.2 ≤θz ≤ 0.8 and ps ≥ 0.23. The number of error-free networks is greater for unambiguous than for ambiguous primary inputs.
Figure 6.
Figure 6.
Two-stage training causes the DSC to extract most of the target information content of the primary inputs, especially when the DSC contains a mixture of unimodal and multisensory units. The percentage of multisensory DSC units is varied by manipulating the primary weight threshold θu. Ten networks receive stage-one training for 5000 iterations (px0 = 0.1, px1 = 0.6, ps = 0.34, and pc = 0.17). Each network is then pruned using θu varying from 0 to 1 in steps of 0.005. This produces mean percentages of multisensory DSC units over the 10 networks ranging from 0 to 100%. Each pruned network receives stage-two training for 5000 iterations (py0 = 0, py1 = 0.1, θx = 6, θy = 0, and θz = 0.2). For each of the 10 networks associated with each θu value, both before and after stage-two training, the mutual information between the target and the number of suprathreshold DSC unit responses is computed (Eqs. 17 and 18; θI = 0.3). The mean information gain after stage-one and stage-two training is plotted against the mean percentages of multisensory units. The mutual information between the target and the primary inputs (2.27 bits; dashed line; Eq. 5) is nearly as high as the information content of the target (2.32 bits; dot-dashed line; Eq. 4). Stage-one training causes the DSC to extract a large amount of target information (triangles), and stage-two (stars) causes a small increase in this amount. The increase is significant when the percentage of multisensory units is 60% or larger (t test, 0.05 significance level). The mutual information between target and DSC is nearly as large as the mutual information between target and primary inputs, but only for percentages of multisensory DSC units between ∼10 and 50%. The mutual information between target and DSC decreases steadily as the percentage of multisensory DSC units increases above 50%. This decrease in mutual information between target and DSC approaches that of a uniformly trimodal DSC, with (0.80 bits; square) and without (0.77 bits; circle) modulatory connections. Variability in the DSC response after two-stage training keeps DSC information content above that of the uniformly trimodal DSC.
Figure 7.
Figure 7.
Responses of a bimodal, visual-auditory DSC unit over the full range of primary input levels. The responses were determined after the network containing this unit was trained using the two-stage algorithm with the following parameters: ps = 0.34, pc = 0.17, px0 = 0.1, px1 = 0.6,θu = 0.4, py0 = 0, py1 = 0.1,θx = 6,θy = 0, andθz = 0.2. The solid and dashed curves show the visual and auditory modality-specific responses, respectively. The curves with × symbols show the cross-modal response, and the curves with + symbols show the sum of the modality-specific responses. Responses with and without modulatory connections are shown in A and B, respectively. Responses at all input levels are subadditive without modulatory connections (B) but can be supra-additive over a narrow range with modulatory connections (A). V, Visual; A, auditory; S, somatosensory.
Figure 8.
Figure 8.
MSE in the corticotectal model depends on unimodal modulatory inputs. Responses of the bimodal, visual-auditory DSC unit from Figure 7 are computed, to targets of visual (V), auditory (A), both (V, A), or neither (spont) modality. Active primary inputs were assigned a value of six, because this value was found to produce maximal MSE for this DSC unit. Responses are shown for the intact model (A) and after interruption of modulatory connections of the visual (B), auditory (C), or both (D) modalities. Interruption of modulatory connections has little effect on modality-specific responses but greatly decreases cross-modal responses and reduces MSE. The reduction in MSE is greatest when modulatory connections of both modalities are interrupted (D). This result is a consequence of training with the correlation-anti-correlation rule in stage two, which produces cross-modal but not modality-specific modulatory connections. The amount of MSE in the model is affected by both the magnitude of modulatory weights and the primary input spontaneous activation probability. In E-H, the modulatory weights have been increased by seven times (v large), and the spontaneous activation probability for the primary inputs has been reduced to zero (px0 = 0). Active primary inputs are assigned a value of three, because this value now produces maximum MSE. Responses are shown for the intact model (E) and after interruption of the modulatory connections of the visual (F), auditory (G), or both (H) modalities. The effect of the modulatory connections is qualitatively the same as before (px0 = 0.1, v normal), but maximal percentage enhancement is higher. Also, the effect of removal of modulatory connections is greater than before for cross-modal responses and nil for modality-specific responses.

Similar articles

Cited by

References

    1. Anastasio TJ, Patton PE, Belkacem-Boussaid K ( 2000) Using Bayes' rule to model multisensory enhancement in the superior colliculus. Neural Comput 12: 997-1019. - PubMed
    1. Anwyl R ( 1999) Metabotrophic glutamate receptors: electrophysiological properties and role in plasticity. Brain Res Rev 29: 83-120. - PubMed
    1. Appelbaum D ( 1996) Probability and information: an integrated approach, Chap 5.7, pp 81-84. Cambridge, UK: Cambridge UP.
    1. Binns KE ( 1999) The synaptic pharmacology underlying sensory processing in the superior colliculus. Prog Neurobiol 59: 129-159. - PubMed
    1. Binns KE, Salt TE ( 1996) Importance of NMDA receptors for multimodal integration in the deep layers of the cat superior colliculus. J Neurophysiol 75: 920-930. - PubMed

Publication types

LinkOut - more resources