. 2003 Jul 30;23(17):6798-809.
doi: 10.1523/JNEUROSCI.23-17-06798.2003.

Coherent oscillations in neuronal activity of the supplementary motor area during a visuomotor task

Affiliations

Coherent oscillations in neuronal activity of the supplementary motor area during a visuomotor task

Daeyeol Lee. J Neurosci. .

Abstract

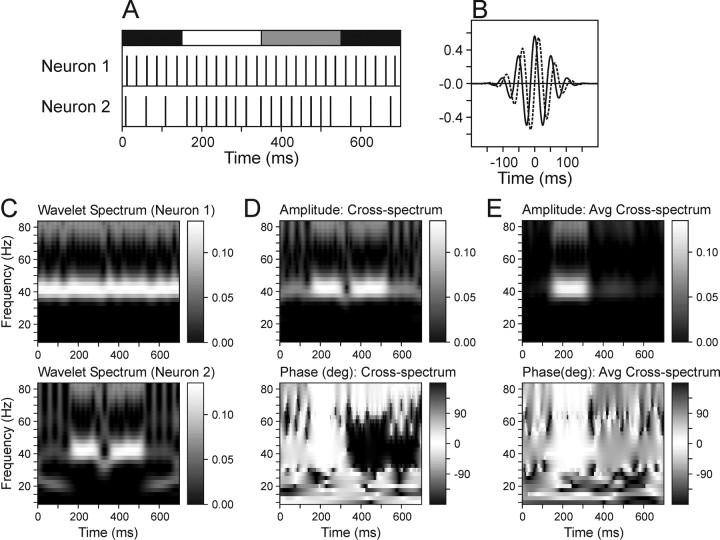
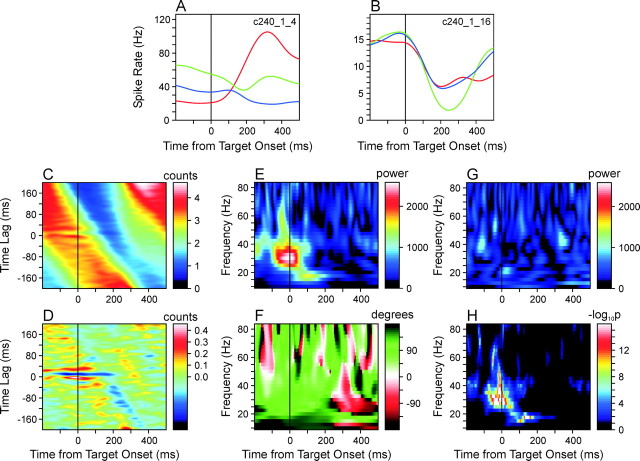
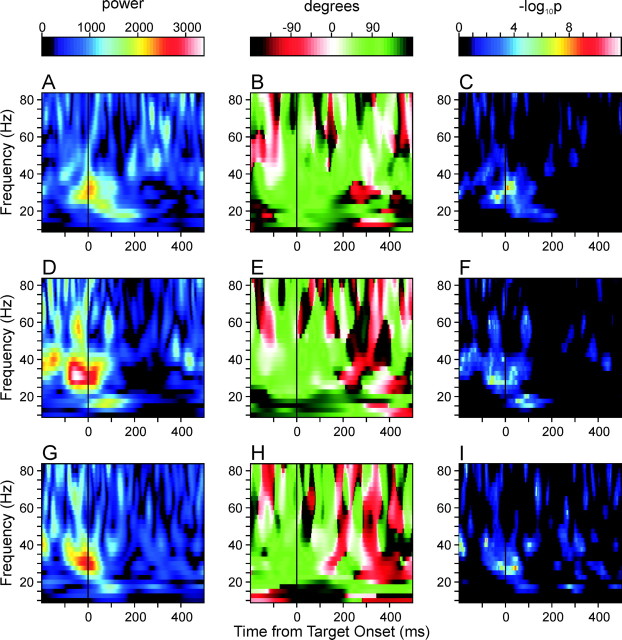
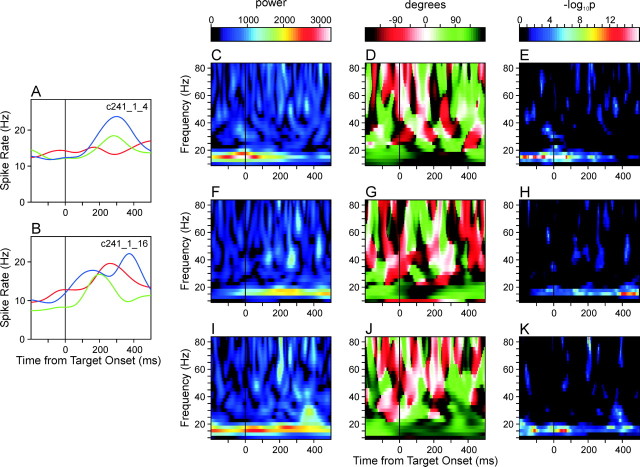
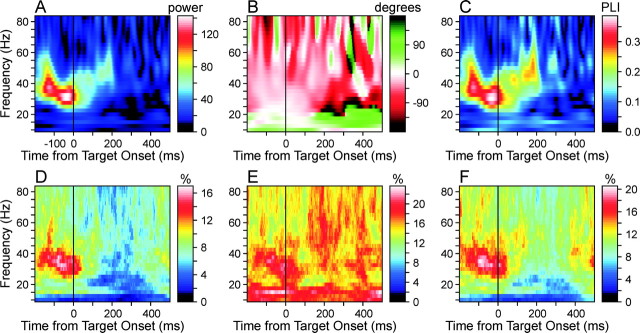
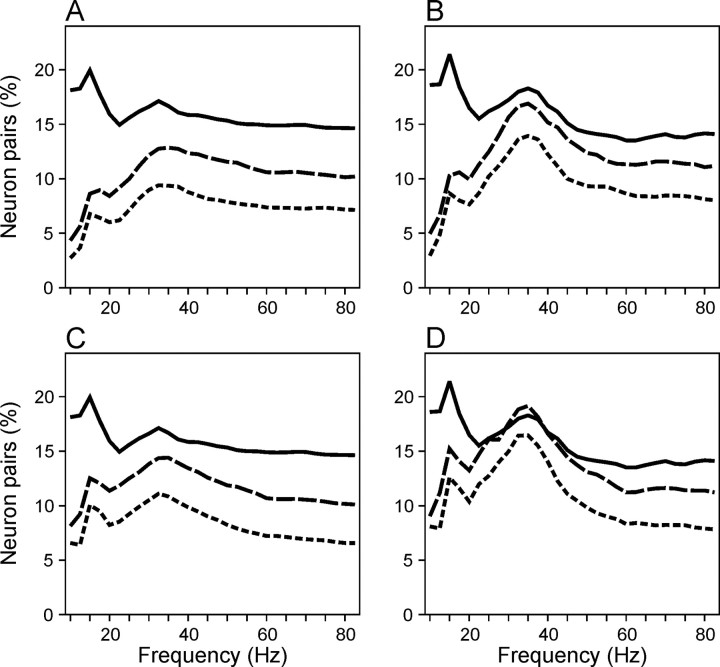
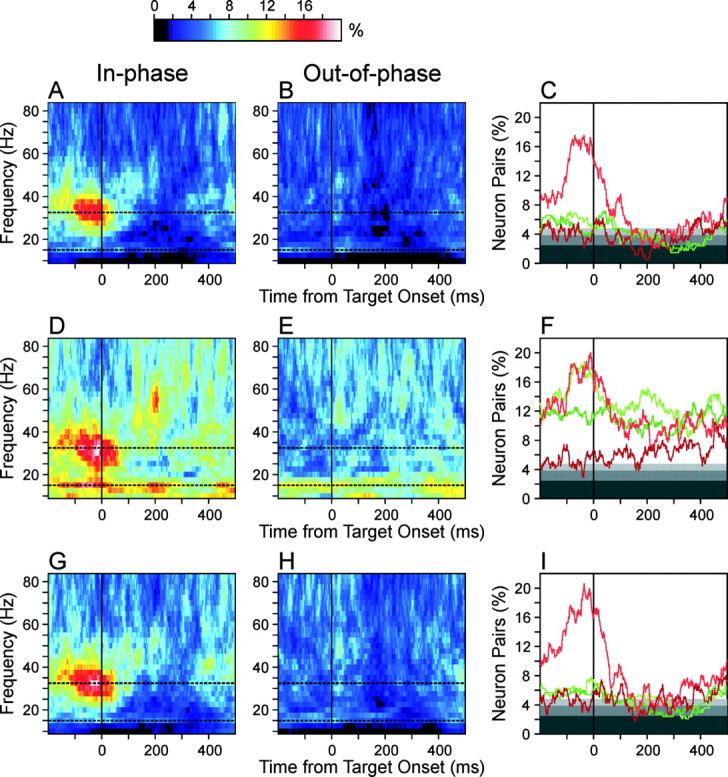
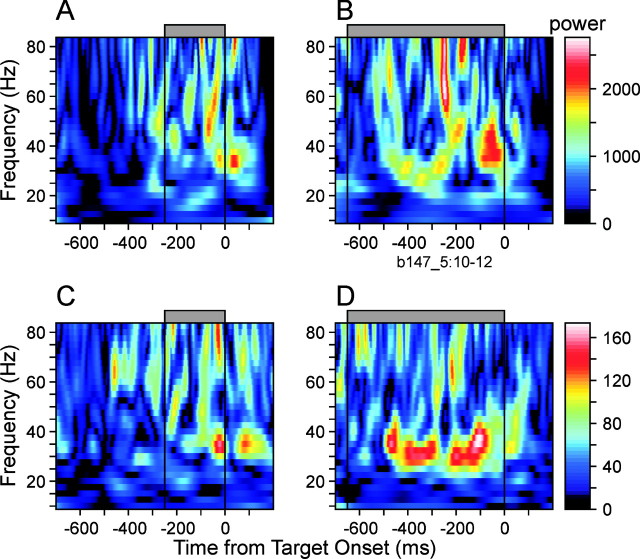
Neural activity recorded in behaving animals is nonstationary, making it difficult to determine factors influencing its temporal patterns. In the present study, rhesus monkeys were trained to produce a series of visually guided hand movements according to the changes in target locations, and multichannel single-neuron activity was recorded from the caudal supplementary motor area. Coherent oscillations in neural activity were analyzed using the wavelet cross-spectrum, and its statistical significance was evaluated using various methods based on surrogate spike trains and trial shuffling. A population-averaged wavelet cross-spectrum displayed a strong tendency for oscillatory activity in the gamma frequency range (30 approximately 50 Hz) to synchronize immediately before and after the onset of movement target. The duration of synchronized oscillations in the gamma frequency range increased when the onset of the next target was delayed. In addition, analysis of individual neuron pairs revealed that many neuron pairs also displayed coherent oscillations in the beta frequency range (15-30 Hz). Coherent beta frequency oscillations were less likely to be synchronized than gamma frequency oscillations, consistent with the fact that coherent beta frequency oscillations were not clearly seen in the population-averaged cross-spectrum. For a given neuron pair, the time course and phase of coherent oscillations were often similar across different movements. These results are consistent with the proposal that synchronized oscillations in the gamma frequency range might be related to the anticipation of behaviorally relevant events and the contextual control of cortical information flow.


Figures

Figure 1.
Figure 1.
The wavelet cross-spectrum can detect coherent oscillations in simultaneously recorded spike trains. A, Examples of two separate simulated spike trains. Spikes in Neuron 1 were generated at the constant frequency of 40 Hz, whereas the frequency of spikes in Neuron 2 changed from 20 Hz during the first 150 msec (black bar at top), to 40 Hz during the next 400 msec (white, gray bars), and back to 20 Hz during the last 150 msec (black bar). During the period indicated by the white bar, the spikes of the two neurons were synchronized, whereas the gray bar indicates the period in which the spikes of the two neurons were counterphased. The exact timing of spikes was jittered according to a normal distribution with the SD of 1 msec. B, Example of the Morlet wavelet function with the frequency of 20 Hz (scale, 50 msec) centered at 0 msec. Real and imaginary components are indicated by solid and dotted lines, respectively. C, Wavelet spectra calculated for the spike trains of Neurons 1 (top) and 2 (bottom). D, Amplitude (top) and relative phase (bottom) of the wavelet cross-spectrum computed for the same spike trains. E, Amplitude (top) and relative phase (bottom) of the average wavelet cross-spectrum. This was calculated over 10 different pairs of simulated spike trains like those in A. The spikes during the interval indicated by the white bar were always synchronized, whereas the relative phase of the spikes during the interval indicated by the gray bar was randomly varied.
Figure 2.
Figure 2.
Circular variance for the phase difference between the two simulated Poisson spike trains generated with the same spike density functions. Spike density functions were computed using a Gaussian kernel with the same SD used in the analysis of the present study (σ = 40 msec). The circular variance is defined as: formula image where rk = sinϕk + icosϕk; ϕk is the phase difference for a given frequency between the two spike trains in trial k; and N is the number of trials (N = 500). If the phase difference is completely randomized across different trials, the circular variance would be close to 1. For this simulation, the phase was calculated from the Fourier transform of the spike train. The simulation was performed for two different spike rates (5, 10 Hz; dotted, solid lines, respectively).
Figure 3.
Figure 3.
Coherent oscillations in an example neuron pair recorded from two separate electrodes in the supplementary motor area during the task with a constant RSI (250 msec). A, B, Spike density functions of the two neurons, averaged separately for three movements directed to the target triplet used in the primary trials. C, TrCCF calculated for the same neuron pair. This was smoothed with a two-dimensional Gaussian kernel withσx = 40 msec andσy = 4 msec. D, Difference between the smoothed TrCCF (C) and the TrCCF expected for independent spike trains. The latter was calculated on the basis of the spike density functions of the individual neurons (see Materials and Methods). E, F, Amplitude (or power; E) and relative phase (F) of the AWCS computed for the same neuron pair. G, Amplitude of the AWCS computed for the Poisson surrogate spike trains generated according to the spike density functions of the same neuron pair. H, Map of statistical significance (p values) calculated from a set of 10 surrogate AWCSs as shown in G (see Materials and Methods).
Figure 4.
Figure 4.
Amplitude (A, D, G), relative phase (B, E, H), and the map of p values (C, F, I) of the average wavelet cross-spectra of the same neuron pair illustrated in Figure 3, computed separately for three different movements directed toward the triplet of targets used in the primary trials. The average spike density functions for these three different movements are indicated by different colors in Figure 3,A and B (A-C, red; D-F, green; G-I, blue).
Figure 5.
Figure 5.
Coherent oscillation in the β frequency range found in a pair of SMA neurons. A, B, Spike density functions of individual neurons, same format as in Figure 3. C-K, Amplitude (C, F, I), relative phase (D, G, J), and the map of p values (E, H, K) of the average wavelet cross-spectra calculated separately for the movements directed to three different targets, same format as in Figure 4.
Figure 6.
Figure 6.
Coherent oscillations in the population of SMA neurons. A, B, Amplitude (A) and phase (B) of the population AWCS. C, Phase-locking index for the population AWCS (see Materials and Methods). D-F, Percentage of neuron pairs (N = 217 neuron pairs × 3 movements = 651) with coherent oscillations that were judged to be statistically significant (p < 0.05), according to the methods based on Poisson surrogate spike trains (D), trial shuffling (E), and their combination (F).
Figure 7.
Figure 7.
A, Average percentage of neuron pairs with statistically significant coherent oscillations collapsed across the entire duration of the analysis window shown in Figure 6. The results obtained with the method of Poisson surrogate spike trains (solid line), trial shuffling (dotted line), and their combination (dashed line) are shown separately. B, Average percentage of neuron pairs with significant coherent oscillations estimated using the same methods as in A during the 200 msec interval before target onset. C, D, Same as in A and B, except that surrogate spike trains were generated as aγ process with a shape parameter of 2 to incorporate a refractory period.
Figure 8.
Figure 8.
Percentage of neuron pairs that displayed significant coherent oscillations with small (<90°; A, D, G) and large (≥90°; B, E, H) phase differences among neuron pairs in which the average activity was ≥5 spikes/sec for both neurons (N = 335). C, F, I, Percentage of neuron pairs with significant coherent oscillations with small (light) and large (dark) phase differences calculated for the two frequency values selected at the peaks ofβ andγ frequency bands (green, 15 Hz; red, 32.5 Hz) as indicated by the dotted lines in the other panels. Given the level of statistical significance used for testing individual neuron pairs (5%), the expected percentage of neuron pairs with significant coherent oscillations for each of the in-phase and out-of-phase groups is 2.5%, as indicated by the border between the dark and intermediate levels of gray. Light gray and white backgrounds correspond to p < 0.05 and 0.01, respectively. The results obtained with the method of Poisson surrogate spike trains (A-C), trial shuffling (D-F), and their combination (G-I) are shown separately.
Figure 9.
Figure 9.
Effect of the RSI on coherent oscillations in the SMA. A, B, Amplitude of the average wavelet cross-spectrum in an example pair of SMA neurons during a short (250 msec; A) and long (650 msec; B) RSI. C, D, Amplitude of population-averaged wavelet cross-spectrum. RSI is indicated by the gray bar at the top.

Similar articles

Cited by

References

    1. Aertsen AMHJ, Gerstein GL, Habib MK, Palm G ( 1989) Dynamics of neuronal firing correlation: modulation of “effective connectivity.” J Neurophysiol 61: 900-917. - PubMed
    1. Andrew C, Pfurtscheller G ( 1996) Event-related coherence as a tool for studying dynamic interaction of brain regions. Electroencephalogr Clin Neurophysiol 98: 144-148. - PubMed
    1. Aoki F, Fetz EE, Shupe L, Lettich E, Ojemann GA ( 1999) Increased gamma-range activity in human sensorimotor cortex during performance of visuomotor task. Clin Neurophysiol 110: 524-537. - PubMed
    1. Baker SN, Lemon RN ( 2000) Precise spatiotemporal repeating patterns in monkey primary and supplementary motor areas occur at chance levels. J Neurophysiol 84: 1770-1780. - PubMed
    1. Baker SN, Spinks R, Jackson A, Lemon RN ( 2001) Synchronization in monkey motor cortex during a precision grip task. I. Task-dependent modulation in single-unit synchrony. J Neurophysiol 85: 869-885. - PubMed

Publication types