. 2003 Jul 30;23(17):6847-55.
doi: 10.1523/JNEUROSCI.23-17-06847.2003.

Evidence for chelatable zinc in the extracellular space of the hippocampus, but little evidence for synaptic release of Zn

Affiliations

Evidence for chelatable zinc in the extracellular space of the hippocampus, but little evidence for synaptic release of Zn

Alan R Kay. J Neurosci. .

Erratum in

  • J Neurosci. 2004 Jan 21;24(3):Table of Contents

Abstract

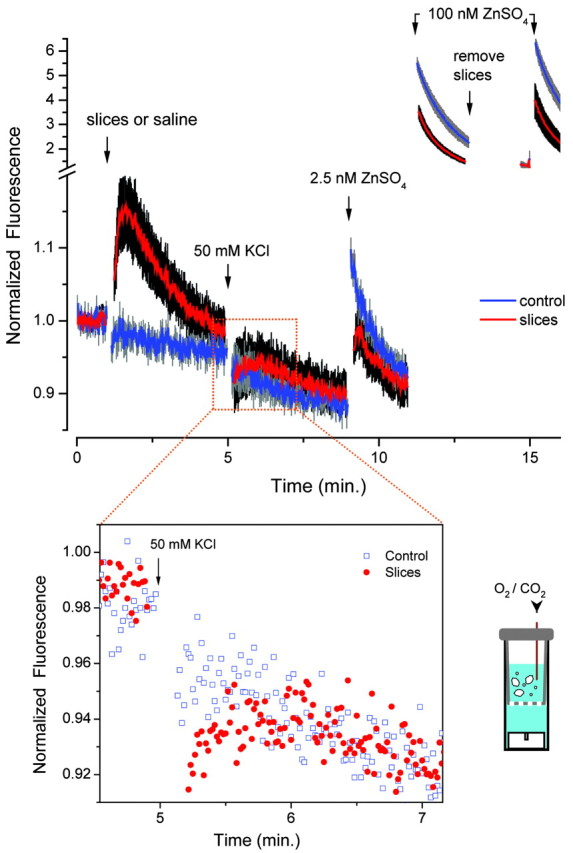
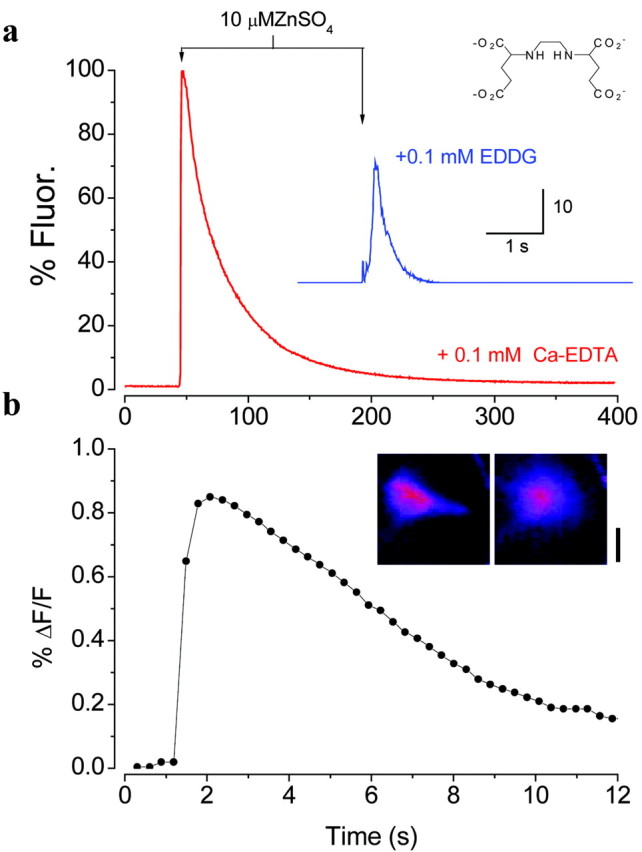
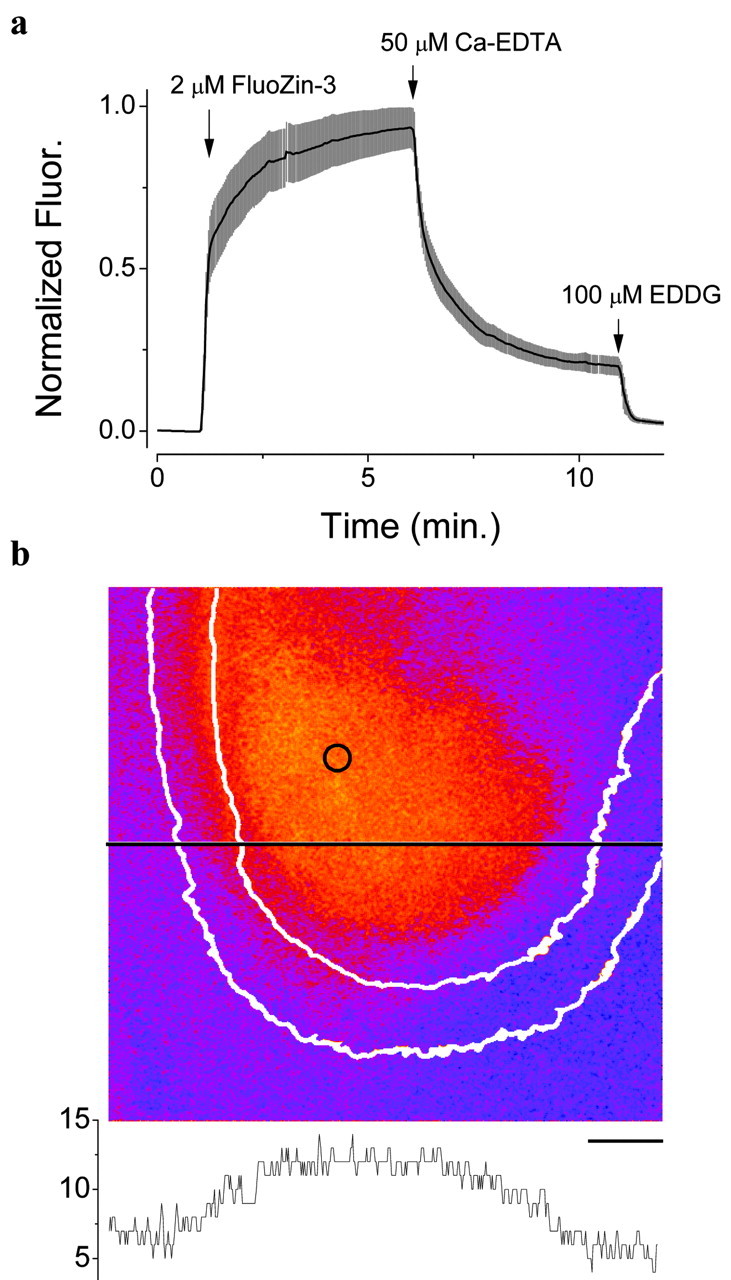
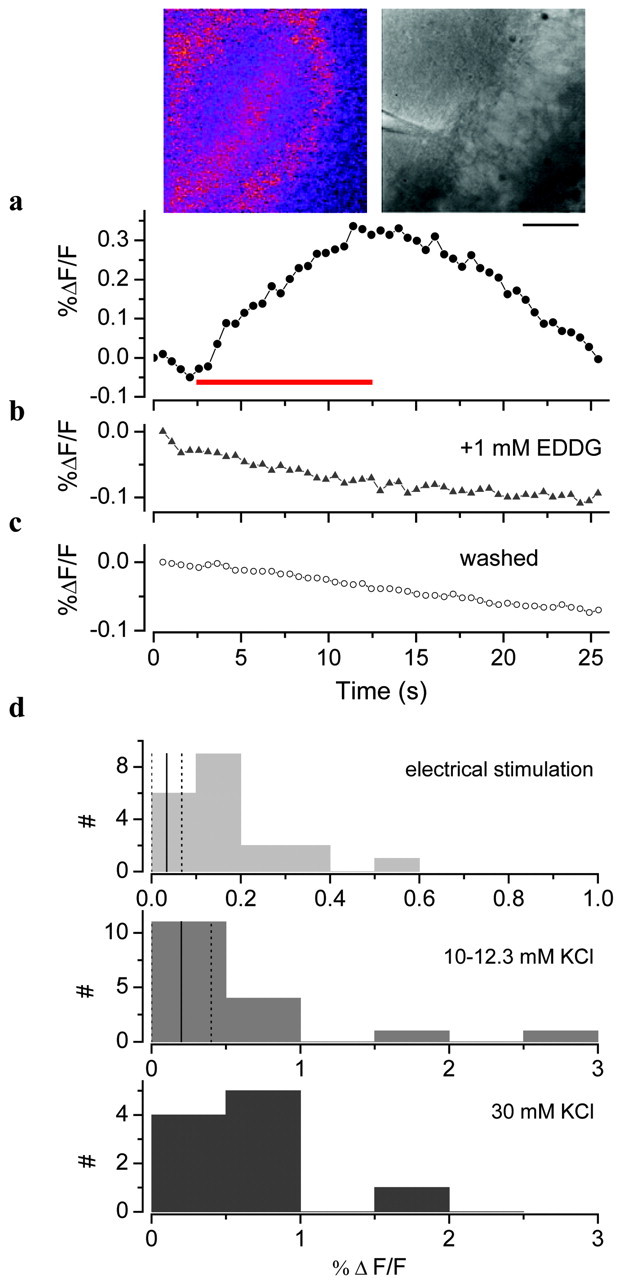
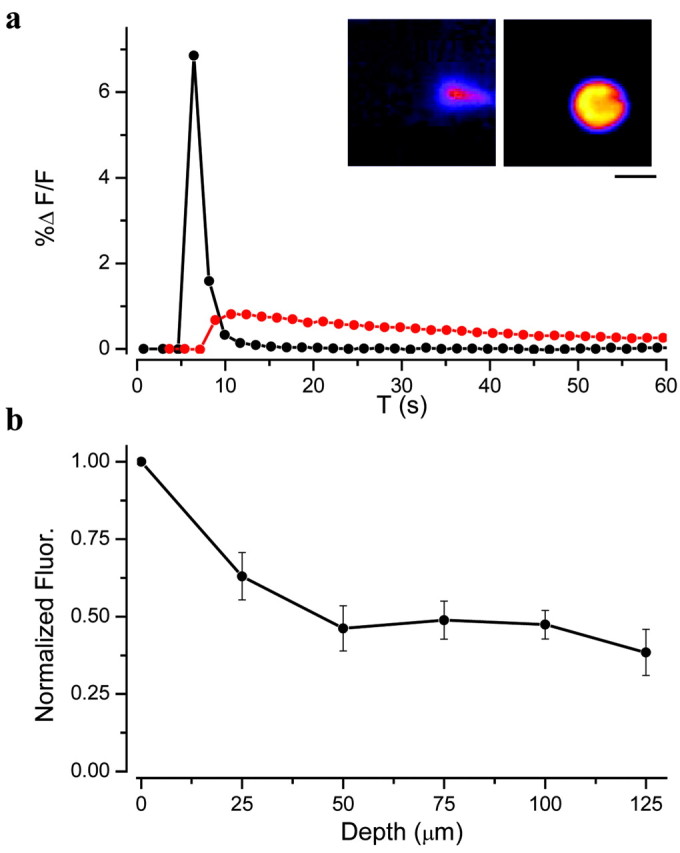
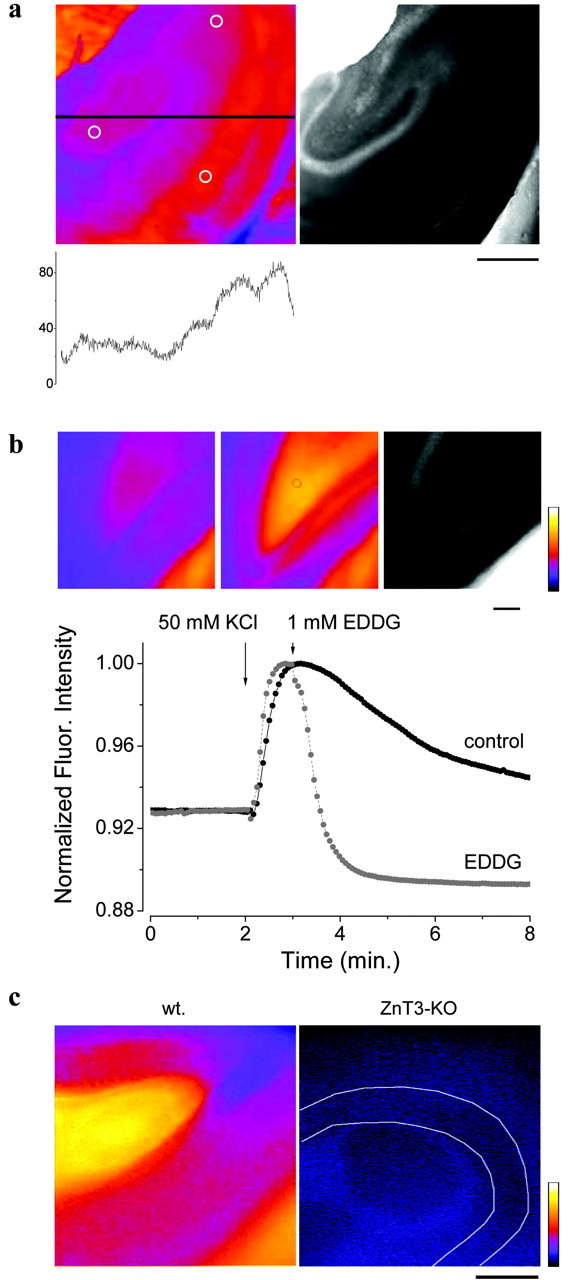
Zinc colocalizes with glutamate in the synaptic vesicles of certain glutamatergic vesicles in the mammalian brain. Here, I introduce a method for detecting Zn in the extracellular space of brain slices and another method for detecting the passage of Zn out of the slice. In both cases, the fluorimetric Zn probe FluoZin-3 is used in conjunction with a slow Zn chelator, Ca-EDTA, to reduce background fluorescence. In addition, a new Zn chelator, ethylenediiminodi-2-pentanedioic acid, with little affinity for Ca or Mg is introduced. These tools are then used to show that little Zn (approximately 2 nm) is released during the course of synaptic transmission into the extracellular space. However, when hippocampal slices are subjected to a high potassium stimulus (50 mM) combined with an increase in osmolarity, Zn is externalized in the Timm's-stained areas (approximately 6 nm). This stimulus also leads to even greater Zn elevations in area CA1 that is only weakly stained by the Timm's method. Nevertheless, even under these conditions, little if any Zn makes its way out of the slices. I present evidence for a layer of Zn in the extracellular space that maps onto the Timm's stained region of the hippocampus. This Zn veneer appears to be loosely associated with molecules in the extracellular space and may be the raison d'être for vesicular Zn.


Figures

Figure 6.
Figure 6.
Slices in a basket. a, Normalized fluorescence measured in a fluorimeter with seven hippocampal slices suspended over the light beam (bottom-right inset) (mean ± SEM; control, n = 4; slices, n = 8). The solution contained 2 μm FluoZin-3 and 50 μm Ca-EDTA at 32°C. Bottom-left inset is a blowup of the rectangular selection without the SEMs. In the inset, the control data have been adjusted to coincide with the first 10 sec before the addition of the KCl, to correct for the difference in the initial fluorescent intensity before stimulation. Concentrations denoted on the graph are final concentrations.
Figure 1.
Figure 1.
Chelation of Zn from FluoZin-3 and the sensitivity of the FluoZin-3 to Zn. a, Response of FluoZin-3 (500 nm) to the addition of ZnSO4 in the presence of Ca-EDTA or EDDG (inset). The fluorescence (Fluor.) is expressed relative to the fluorescence attained on the addition of ZnSO4 to a solution without the chelator. The fluorescence declined with a time constant of 32 sec on the addition of Zn in the presence of Ca-EDTA. The experiments were performed in the HEPES-buffered saline with 2 mm CaCl2 and 2 mm MgSO4 at 26°C. b, Response of FluoZin-3 to the pressure ejection of 1 μm ZnSO4 from an electrode. The experiment was performed in physiological saline at 32°C. Inset, Images of the experiments at 2 and 6 sec. Scale bar, 100 μm.
Figure 2.
Figure 2.
Evidence for extracellular chelatable Zn. a, Fluorescence (Fluor.) in the hilus of the dentate gyrus (circle in b) during the addition of 2 μm FluoZin-3, followed by the addition of 50 μm Ca-EDTA and then 100 μm EDDG (mean ± SEM; n = 4). b, Pseudocolor image of the difference between an image acquired in the presence of FluoZin-3 and 50 μm Ca-EDTA and that after the addition of 1 mm EDDG. The intensity of the fluorescence along the black line is graphed below and in register with the figure. The irregular white lines delimit the granule cell layer. Scale bar, 100 μm.
Figure 3.
Figure 3.
Electrically induced changes in FluoZin-3 fluorescence. Response of hippocampal slice to electrical stimulation (100 Hz, 10 sec; red bar) in the hilus in 2 μm FluoZin-3 and 25 μm Ca-EDTA (a), 2 μm FluoZin-3, 25 μm Ca-EDTA, and 1 mm EDDG (b), and after washing for 20 min (c). Insets, Left, Difference in fluorescence between the image at 13 and 2 sec. Right, Bright-field image with the stratum pyramidale of area CA4 on the right and the electrode in stratum radiatum. Scale bar, 100 μm. d, Change in fluorescence induced by electrical (100 Hz, 5-10 sec) and potassium stimulation in the hilus of the dentate gyrus and CA4. Vertical lines, Mean (solid) ± SD (dotted) of controls.
Figure 4.
Figure 4.
a, Imaging the fluorescence induced by the pressure ejection of ZnSO4 (10 μm in HEPES saline with 1.3 mm MgSO4 and 2 mm CaCl2; pulse duration, 60 msec; 18 psi) into a hippocampal slice bathed with 2 μm FluoZin-3 and 50 μm Ca-EDTA just above the surface of the slice (black circles) or 70 μm below the surface of the slice (red circles). Insets, At peak of response within slice (left) and out of slice (right). Scale bar, 100 μm. T, Time. b, Dependence of the peak fluorescence induced by the pressure ejection of 10 μm ZnSO4 as a function of the depth of penetration of the electrode into the slice. The fluorescence has been normalized by the response obtained with the electrode out of the slice (0 μm). Mean ± SEM (n = 3). Fluor., Fluorescence.
Figure 5.
Figure 5.
Stimulation of hippocampal slices with 50 mm KCl. a, Left, Pseudocolor difference image of the slice at the peak of the response and that before stimulation. The intensity profile along the line indicated in the image is graphed in register below the image. Circles indicate the approximate positions used for measurements of fluorescence in the dentate gyrus (left), CA3 (top), and CA1 (bottom). Right, Bright-field image of the same slice. FluoZin-3 (2 μm) and Ca-EDTA (50 μm). Note that the images appear different because of the inadvertent saturation of the image in the top-left corner of the bright-field image. Scale bar, 0.5 mm. b, Application of 1 mm EDDG chelates Zn released by a 50 mm KCl stimulus. Insets, Fluorescence before stimulation (2 min) (left), after stimulation at the peak of the response (control) (middle), and bright field of the same slice (right). Scale bar, 100 μm. Pseudocolor scale, 0-255. Fluor., Fluorescence. c, Image of mouse dentate gyrus during stimulation with 50 mm KCl in the presence of 2 μm FluoZin-3 and 50 μm Ca-EDTA in wild-type (wt) and ZnT3-null mice (ZnT3-KO) (the white lines delimit the granule cell layer). Images are the difference between fluorescence at the peak of the response and that before potassium stimulation. Pseudocolor scale, 0-255; scale bar, 100 μm.

Similar articles

Cited by

References

    1. Anikstejn L, Charton G, Ben-Ari Y ( 1987) Selective release of endogenous zinc from the hippocampal mossy fibers in situ. Brain Res 404: 58-64. - PubMed
    1. Arslan P, Di Virgilio F, Beltrame M, Tsien RY, Pozzan T ( 1985) Cytosolic Ca2+ homeostasis in Ehrlich and Yoshida carcinomas: a new, membrane-permeant chelator of heavy metals reveals that these ascites tumor cell lines have normal cytosolic free Ca2+ J Biol Sci 260: 2719-2727. - PubMed
    1. Assaf SY, Chung S-H ( 1984) Release of endogenous Zn2+ from brain tissue during activity. Nature 308: 734-735. - PubMed
    1. Billington N, Knight AW ( 2001) Seeing the wood through the trees: a review of techniques for distinguishing green fluorescent protein from endogenous autofluorescence. Anal Biochem 291: 175-197. - PubMed
    1. Budde T, Minta A, White JA, Kay AR ( 1997) Imaging free zinc in synaptic terminals in live hippocampal slices. Neuroscience 79: 347-358. - PubMed

Publication types

MeSH terms

LinkOut - more resources