. 2003 Aug 15;17(16):2006-20.
doi: 10.1101/gad.1098703. Epub 2003 Jul 31.

Control of cell number by Drosophila FOXO: downstream and feedback regulation of the insulin receptor pathway

Affiliations

Control of cell number by Drosophila FOXO: downstream and feedback regulation of the insulin receptor pathway

Oscar Puig et al. Genes Dev. .

Abstract

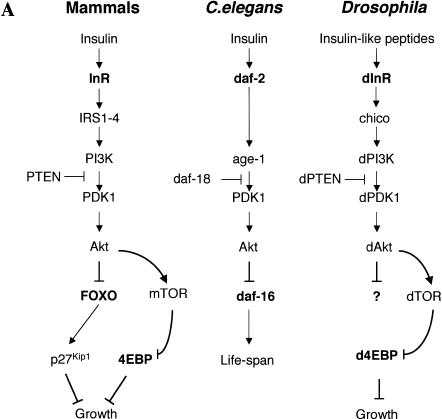
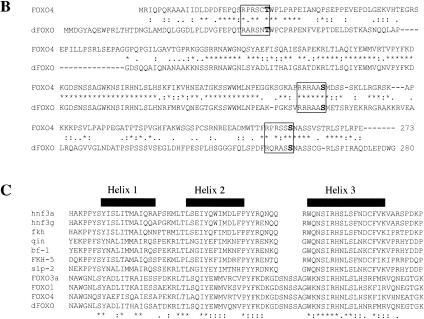
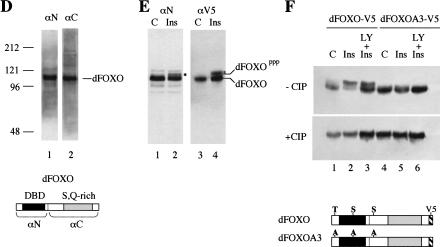
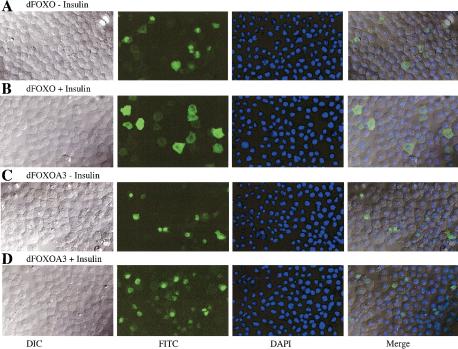
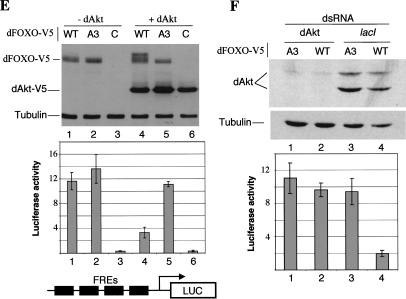
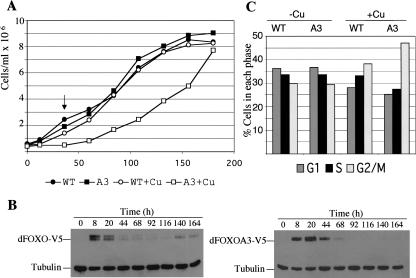
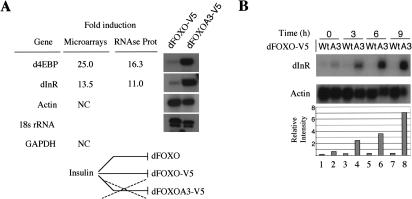
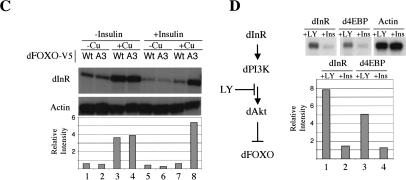
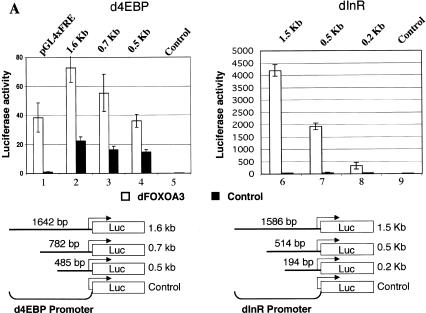
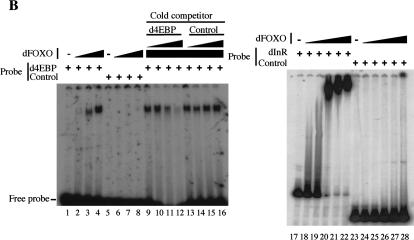
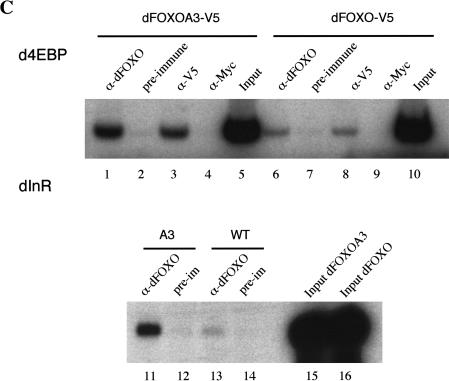
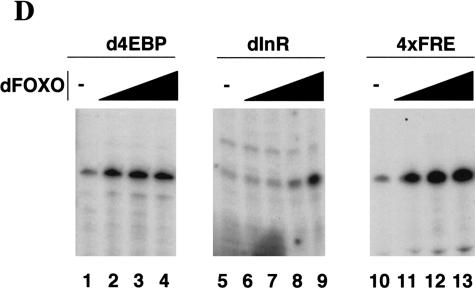
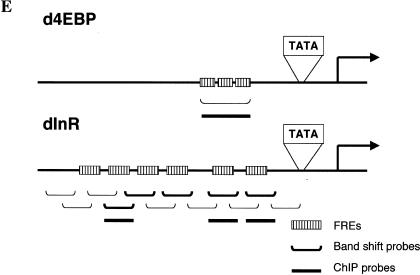
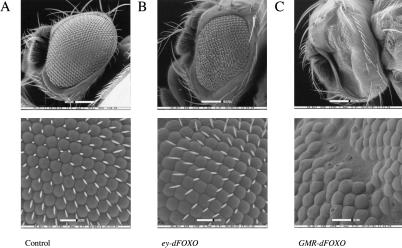
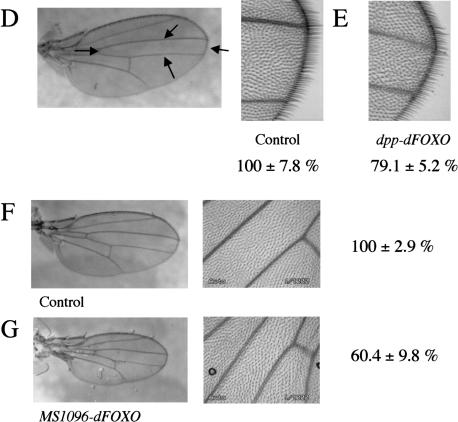
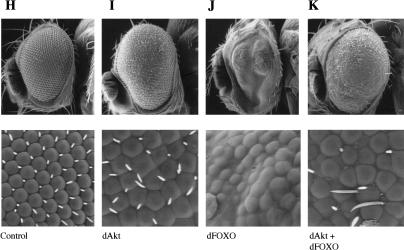
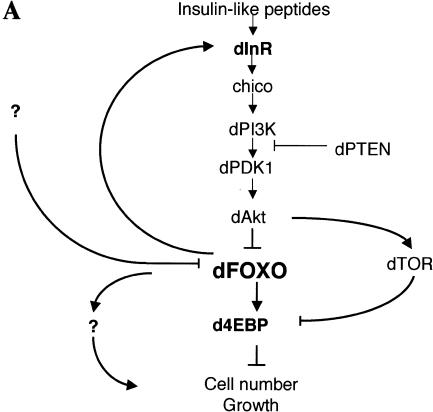
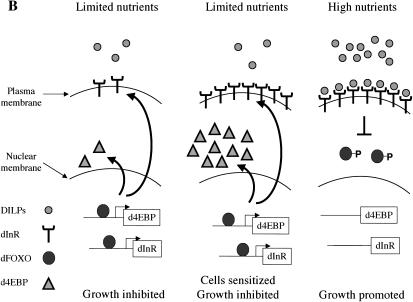
The Drosophila insulin receptor (dInR) regulates cell growth and proliferation through the dPI3K/dAkt pathway, which is conserved in metazoan organisms. Here we report the identification and functional characterization of the Drosophila forkhead-related transcription factor dFOXO, a key component of the insulin signaling cascade. dFOXO is phosphorylated by dAkt upon insulin treatment, leading to cytoplasmic retention and inhibition of its transcriptional activity. Mutant dFOXO lacking dAkt phosphorylation sites no longer responds to insulin inhibition, remains in the nucleus, and is constitutively active. dFOXO activation in S2 cells induces growth arrest and activates two key players of the dInR/dPI3K/dAkt pathway: the translational regulator d4EBP and the dInR itself. Induction of d4EBP likely leads to growth inhibition by dFOXO, whereas activation of dInR provides a novel transcriptionally induced feedback control mechanism. Targeted expression of dFOXO in fly tissues regulates organ size by specifying cell number with no effect on cell size. Our results establish dFOXO as a key transcriptional regulator of the insulin pathway that modulates growth and proliferation.


Figures

Figure 1.
Figure 1.
(A) The insulin receptor signaling pathway is conserved in mammals, C. elegans, and Drosophila. (B) Identification of a Drosophila homolog of FOXO/DAF-16. Sequence alignment showing the high degree of conservation displayed in the DNA-binding domains of FOXO4 and dFOXO. The three conserved Akt phosphorylation motifs are boxed, and the amino acids that can be phosphorylated are in boldface. Asterisks mark identical amino acids; colons mark conserved amino acid changes; dots indicate weakly conserved changes. (C) FOXO family members have a 5-amino-acid insertion between helices 2 and 3 in the DNA-binding domain, which is lacking in the rest of forkhead-related proteins. (D) Antibodies raised against recombinant C- and N-terminal regions of dFOXO recognize a band with similar mobility in Drosophila S2 cell extracts. A representation of dFOXO indicating the fragments used for antibody production is shown below. (E) Insulin treatment produces a slower-mobility form of dFOXO (marked with an asterisk) that is detected with endogenous (lanes 1,2) or overexpressed (lanes 3,4) dFOXO. (F) Overexpressed dFOXO is phosphorylated upon insulin treatment of S2 cells (lane 2). Pretreatment of samples with LY294002 before insulin treatment reduces the amount of dFOXO that is phosphorylated (lane 3). dFOXOA3 is not phosphorylated upon insulin treatment (lanes 46). The lower panel shows the same samples after phosphatase treatment. A scheme representing wild-type and mutant dFOXO is shown below.
Figure 1.
Figure 1.
(A) The insulin receptor signaling pathway is conserved in mammals, C. elegans, and Drosophila. (B) Identification of a Drosophila homolog of FOXO/DAF-16. Sequence alignment showing the high degree of conservation displayed in the DNA-binding domains of FOXO4 and dFOXO. The three conserved Akt phosphorylation motifs are boxed, and the amino acids that can be phosphorylated are in boldface. Asterisks mark identical amino acids; colons mark conserved amino acid changes; dots indicate weakly conserved changes. (C) FOXO family members have a 5-amino-acid insertion between helices 2 and 3 in the DNA-binding domain, which is lacking in the rest of forkhead-related proteins. (D) Antibodies raised against recombinant C- and N-terminal regions of dFOXO recognize a band with similar mobility in Drosophila S2 cell extracts. A representation of dFOXO indicating the fragments used for antibody production is shown below. (E) Insulin treatment produces a slower-mobility form of dFOXO (marked with an asterisk) that is detected with endogenous (lanes 1,2) or overexpressed (lanes 3,4) dFOXO. (F) Overexpressed dFOXO is phosphorylated upon insulin treatment of S2 cells (lane 2). Pretreatment of samples with LY294002 before insulin treatment reduces the amount of dFOXO that is phosphorylated (lane 3). dFOXOA3 is not phosphorylated upon insulin treatment (lanes 46). The lower panel shows the same samples after phosphatase treatment. A scheme representing wild-type and mutant dFOXO is shown below.
Figure 2.
Figure 2.
(AD) Insulin regulates subcellular localization of dFOXO. S2 cells overexpressing dFOXO or dFOXOA3 were grown in the absence (A,C) or presence (B,D) of insulin. (E) Akt phosphorylates and inhibits dFOXO activity. (Top) S2 cells grown in the absence of serum/insulin were transfected with dFOXO [wild-type (WT) lanes 1,4], dFOXOA3 (A3, lanes 2,5), or with empty vector (C, lanes 3,6). Myr-dAkt-V5 was cotransfected in lanes 46. (Bottom) Luciferase assays performed with the samples from above and measured with a reporter containing four FOXO4 recognition elements. (F) Insulin inhibits dFOXO through dAkt. Cells were transfected with dFOXO (lanes 2,4) or dFOXOA3 (lanes 1,3) and dsRNA against dAkt (lanes 1,2) or lacI (lanes 3,4) was added. (Bottom) Luciferase activity was measured with the same reporter as in E.
Figure 2.
Figure 2.
(AD) Insulin regulates subcellular localization of dFOXO. S2 cells overexpressing dFOXO or dFOXOA3 were grown in the absence (A,C) or presence (B,D) of insulin. (E) Akt phosphorylates and inhibits dFOXO activity. (Top) S2 cells grown in the absence of serum/insulin were transfected with dFOXO [wild-type (WT) lanes 1,4], dFOXOA3 (A3, lanes 2,5), or with empty vector (C, lanes 3,6). Myr-dAkt-V5 was cotransfected in lanes 46. (Bottom) Luciferase assays performed with the samples from above and measured with a reporter containing four FOXO4 recognition elements. (F) Insulin inhibits dFOXO through dAkt. Cells were transfected with dFOXO (lanes 2,4) or dFOXOA3 (lanes 1,3) and dsRNA against dAkt (lanes 1,2) or lacI (lanes 3,4) was added. (Bottom) Luciferase activity was measured with the same reporter as in E.
Figure 3.
Figure 3.
dFOXO arrests cell growth. (A) S2 cells stably transfected with either wild-type dFOXO (•, ○) or A3 mutant (▪, □) were grown in the presence of insulin. To induce dFOXO expression, an 8-h pulse of Cu2+ was performed (○, □). Only cells expressing dFOXOA3 stop growing during the first 44 h. (B) Western blot of cell extracts obtained from cells induced with Cu2+ in A. (C) Frequencies for G1, S, or G2/M as assayed by FACS for cells after 36 h of Cu2+ addition (arrow in A).
Figure 4.
Figure 4.
dInR and d4EBP are up-regulated by dFOXO. (A) DNA microarrays detected dInR and d4EBP as putative targets for dFOXO. Actin and GAPDH controls remained unchanged. RNase protection confirmed microarray data. (B) RNase protection shows a rapid induction of dInR messenger by dFOXOA3. (C) Cu2+ or insulin treatments per se do not induce transcription of dInR. In the absence of insulin, both wild-type and A3 mutant induce transcription of dInR. In the presence of insulin, only A3 mutant up-regulates this mRNA. (D) The PI3K inhibitor LY294002 induces transcription of dInR and d4EBP, suggesting that endogenous dFOXO is responsible for this effect. For all the panels, the graphic below represents the quantification of data performed on the RNase protection experiment shown above.
Figure 4.
Figure 4.
dInR and d4EBP are up-regulated by dFOXO. (A) DNA microarrays detected dInR and d4EBP as putative targets for dFOXO. Actin and GAPDH controls remained unchanged. RNase protection confirmed microarray data. (B) RNase protection shows a rapid induction of dInR messenger by dFOXOA3. (C) Cu2+ or insulin treatments per se do not induce transcription of dInR. In the absence of insulin, both wild-type and A3 mutant induce transcription of dInR. In the presence of insulin, only A3 mutant up-regulates this mRNA. (D) The PI3K inhibitor LY294002 induces transcription of dInR and d4EBP, suggesting that endogenous dFOXO is responsible for this effect. For all the panels, the graphic below represents the quantification of data performed on the RNase protection experiment shown above.
Figure 5.
Figure 5.
dFOXO directly activates transcription of dInR and d4EBP. (A) Luciferase assays showed activation of d4EBP and dInR promoters in S2 cells after cotransfection with dFOXOA3 (white bars). (Black bars) Empty vector. (B) Band shift performed with d4EBP and dInR promoters showed that recombinant dFOXO binds specifically to these promoters. (C) dFOXO binds specifically to d4EBP and dInR promoters in vivo. ChIP of cross-linked extracts of S2 cells expressing dFOXO or dFOXOA3 grown in prescence of insulin. (D) Recombinant dFOXO activates transcription of d4EBP (lanes 1–4) and dInR (lanes 5–9) promoters and of a synthetic promoter bearing 4 FREs (lanes 10–13) in vitro. (E) Schematic representation of the d4EBP and dInR promoters showing the putative FREs (striped boxes) located upstream of the transcription start sites (indicated by arrows). The probes used in band shifts are indicated below as horizontal brackets, and those probes bound by dFOXO are shown as thick lines. Thick horizontal bars indicate the DNA regions bound in vivo by dFOXO as analyzed by ChIP.
Figure 5.
Figure 5.
dFOXO directly activates transcription of dInR and d4EBP. (A) Luciferase assays showed activation of d4EBP and dInR promoters in S2 cells after cotransfection with dFOXOA3 (white bars). (Black bars) Empty vector. (B) Band shift performed with d4EBP and dInR promoters showed that recombinant dFOXO binds specifically to these promoters. (C) dFOXO binds specifically to d4EBP and dInR promoters in vivo. ChIP of cross-linked extracts of S2 cells expressing dFOXO or dFOXOA3 grown in prescence of insulin. (D) Recombinant dFOXO activates transcription of d4EBP (lanes 1–4) and dInR (lanes 5–9) promoters and of a synthetic promoter bearing 4 FREs (lanes 10–13) in vitro. (E) Schematic representation of the d4EBP and dInR promoters showing the putative FREs (striped boxes) located upstream of the transcription start sites (indicated by arrows). The probes used in band shifts are indicated below as horizontal brackets, and those probes bound by dFOXO are shown as thick lines. Thick horizontal bars indicate the DNA regions bound in vivo by dFOXO as analyzed by ChIP.
Figure 6.
Figure 6.
dFOXO controls growth by affecting cell number. (A,B) Expression of dFOXO in fly eyes reduces eye size without affecting ommatidia size. (A) ey-Gal4/+. (B) ey-Gal4/UAS-dFOXO. (C) Overexpression of dFOXO in eye discs before the morphogenetic furrow (GMR-Gal4/UAS-dFOXO) causes a striking reduction of the eye size with severe ommatidia loss. (DG) Overexpression of dFOXO in fly wings causes reduction in wing size by only affecting cell number. Values are the total average area in percent. (D) dpp-Gal4/+ (100% ± 7.8%). Arrows indicate the area affected by the driver. (E) dpp-Gal4/UAS-dFOXO (79.1% ± 5.2%). (F) MS1096-Gal4/+ (100% ± 2.9%). (G) MS1096-Gal4/UAS-dFOXO (60.4% ± 9.8%). (HK) dAkt partially rescues the phenotype produced by dFOXO expression. (H) GMR-Gal4/+ +/+. (I) GMR-Gal4/+ UAS-dAkt/+. (J) GMR-Gal4/UAS-dFOXO +/+. (K) GMR-Gal4/UAS-dFOXO UAS-dAkt/+.
Figure 6.
Figure 6.
dFOXO controls growth by affecting cell number. (A,B) Expression of dFOXO in fly eyes reduces eye size without affecting ommatidia size. (A) ey-Gal4/+. (B) ey-Gal4/UAS-dFOXO. (C) Overexpression of dFOXO in eye discs before the morphogenetic furrow (GMR-Gal4/UAS-dFOXO) causes a striking reduction of the eye size with severe ommatidia loss. (DG) Overexpression of dFOXO in fly wings causes reduction in wing size by only affecting cell number. Values are the total average area in percent. (D) dpp-Gal4/+ (100% ± 7.8%). Arrows indicate the area affected by the driver. (E) dpp-Gal4/UAS-dFOXO (79.1% ± 5.2%). (F) MS1096-Gal4/+ (100% ± 2.9%). (G) MS1096-Gal4/UAS-dFOXO (60.4% ± 9.8%). (HK) dAkt partially rescues the phenotype produced by dFOXO expression. (H) GMR-Gal4/+ +/+. (I) GMR-Gal4/+ UAS-dAkt/+. (J) GMR-Gal4/UAS-dFOXO +/+. (K) GMR-Gal4/UAS-dFOXO UAS-dAkt/+.
Figure 7.
Figure 7.
(A) dFOXO is a key element of insulin signaling in Drosophila. The insulin receptor inactivates dFOXO through dPI3K/dAkt. Activation of d4EBP may explain growth inhibition by dFOXO, whereas activation of dInR may provide a novel transcriptionally induced feedback control mechanism for the pathway. (B) Model to explain regulation of growth by a feedback mechanism involving dInR and dFOXO.
Figure 7.
Figure 7.
(A) dFOXO is a key element of insulin signaling in Drosophila. The insulin receptor inactivates dFOXO through dPI3K/dAkt. Activation of d4EBP may explain growth inhibition by dFOXO, whereas activation of dInR may provide a novel transcriptionally induced feedback control mechanism for the pathway. (B) Model to explain regulation of growth by a feedback mechanism involving dInR and dFOXO.

References

    1. Alvarez, B., Martinez, A.C., Burgering, B.M., and Carrera, A.C. 2001. Forkhead transcription factors contribute to execution of the mitotic programme in mammals. Nature 413: 744–747. - PubMed
    1. Andrulis, E.D., Guzman, E., Doring, P., Werner, J., and Lis, J.T. 2000. High-resolution localization of Drosophila Spt5 and Spt6 at heat shock genes in vivo: Roles in promoter proximal pausing and transcription elongation. Genes & Dev. 14: 2635–2649. - PMC - PubMed
    1. Ayala, J.E., Streeper, R.S., Desgrosellier, J.S., Durham, S.K., Suwanichkul, A., Svitek, C.A., Goldman, J.K., Barr, F.G., Powell, D.R., and O'Brien, R.M. 1999. Conservation of an insulin response unit between mouse and human glucose-6-phosphatase catalytic subunit gene promoters: Transcription factor FKHR binds the insulin response sequence. Diabetes 48: 1885–1889. - PubMed
    1. Biggin, M.D. and Tjian, R. 1988. Transcription factors that activate the Ultrabithorax promoter in developmentally staged extracts. Cell 53: 699–711. - PubMed
    1. Bohni, R., Riesgo-Escovar, J., Oldham, S., Brogiolo, W., Stocker, H., Andruss, B.F., Beckingham, K., and Hafen, E. 1999. Autonomous control of cell and organ size by CHICO, a Drosophila homolog of vertebrate IRS1-4. Cell 97: 865–875. - PubMed

Publication types

MeSH terms