. 2003 Aug;23(16):5475-88.
doi: 10.1128/MCB.23.16.5475-5488.2003.

Epigenetic properties and identification of an imprint mark in the Nesp-Gnasxl domain of the mouse Gnas imprinted locus

Affiliations

Epigenetic properties and identification of an imprint mark in the Nesp-Gnasxl domain of the mouse Gnas imprinted locus

Candice Coombes et al. Mol Cell Biol. 2003 Aug.

Abstract

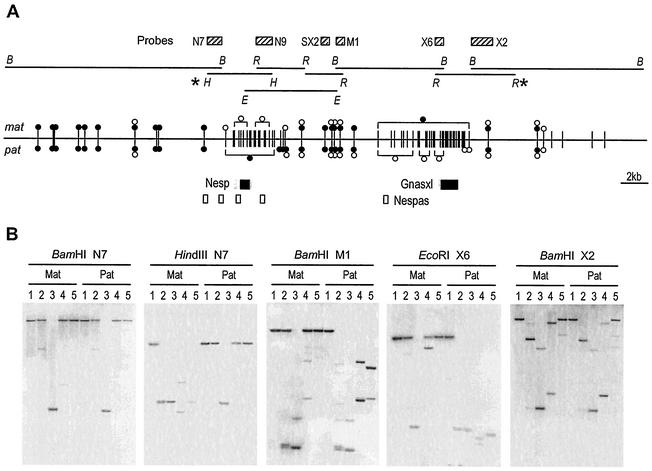
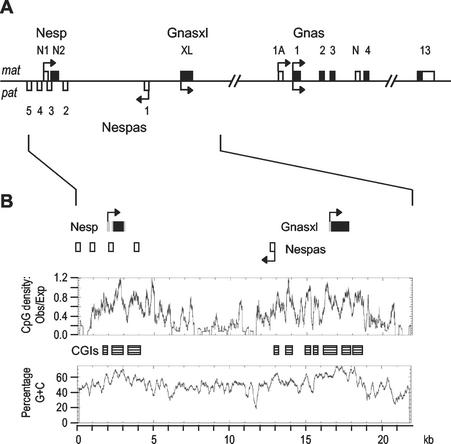
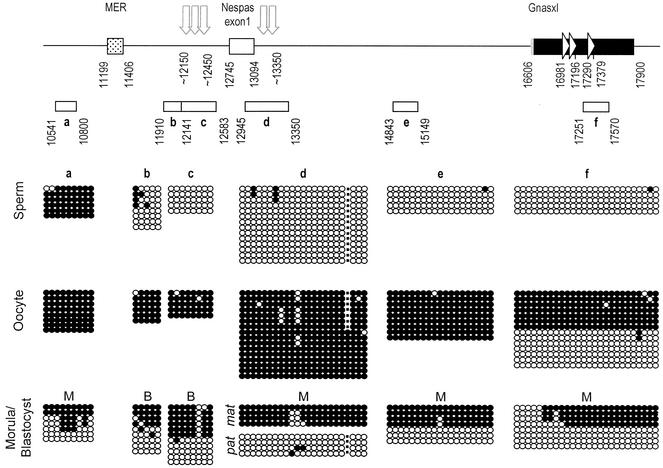
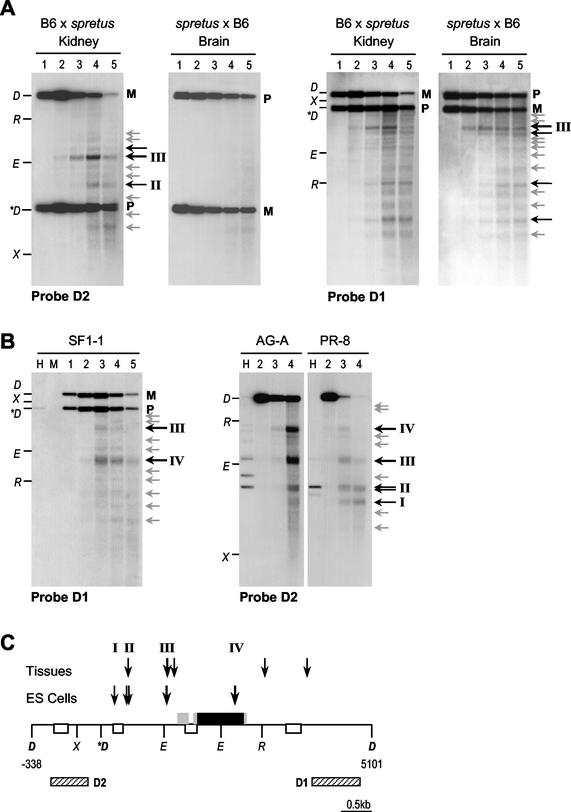
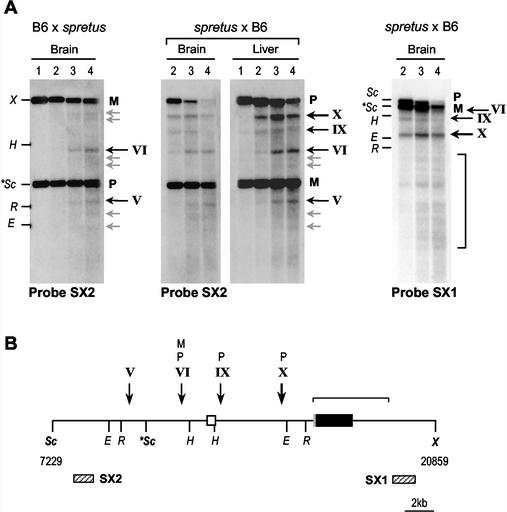
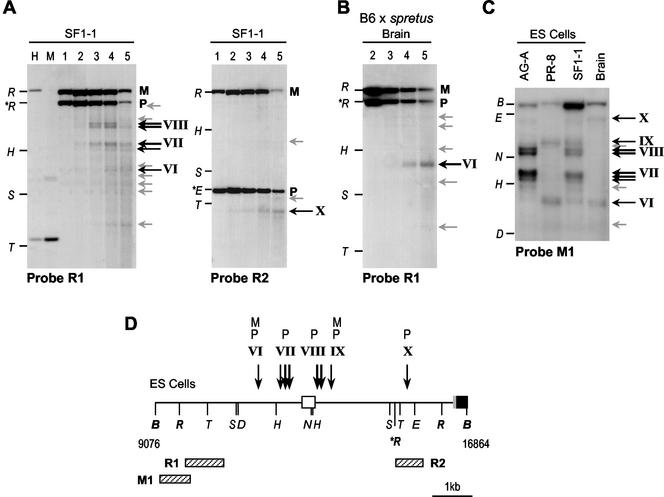
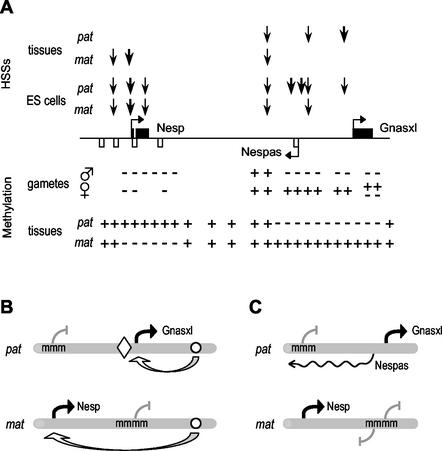
The Gnas locus in the mouse is imprinted with a complex arrangement of alternative transcripts defined by promoters with different patterns of monoallelic expression. The Gnas transcript is subject to tissue-specific imprinted expression, Nesp is expressed only from the maternal allele, and Gnasxl is expressed only from the paternal allele. The mechanisms controlling these expression patterns are not known. To identify potential imprinting regulatory regions, particularly for the reciprocally expressed Nesp and Gnasxl promoters, we examined epigenetic properties of the locus in gametes, embryonic stem cells, and fetal and adult tissues. The Nesp and Gnasxl promoter regions are contained in extensive CpG islands with methylation of the paternal allele at Nesp and the maternal allele at Gnasxl. Parental allele-specific DNase I-hypersensitive sites were found at these regions, which correlate with hypomethylation rather than actual expression status. A germ line methylation mark was identified covering the promoters for Gnasxl and the antisense transcript Nespas. Prominent DNase I-hypersensitive sites present on paternal alleles in embryonic stem cells are contained within this mark. This is the second gametic mark identified at Gnas and suggests that the Nesp and Gnasxl promoters are under separate control from the Gnas promoter. We propose models to account for the regulation of imprinting at the locus.


Figures

FIG. 1.
FIG. 1.
The Nesp-Gnasxl domain of the Gnas imprinted cluster. (A) Schematic overview of the mouse Gnas locus. Exons of the Nesp, Gnasxl and Gnas transcripts are shown above the line (for simplicity, not all Gnas exons are shown): coding regions are filled, noncoding regions open. Exons for the Nespas antisense transcript are shown below the line. Promoters are indicated by horizontal arrows, with those maternally expressed (mat) shown above the line and those paternally expressed (pat) shown below the line. The Nesp and Gnasxl exons are 48.8 and 34.0 kb upstream of Gnas exon 2, respectively, onto which they are both spliced. (B) Sequence properties of the Nesp-Gnasxl domain. A graphical output of sequence AJ251761 analyzed by CPGPLOT is shown. CpG islands (CGIs) are identified as boxes.
FIG. 2.
FIG. 2.
Extent of differential methylation across the Nesp-Gnasxl domain. (A) The restriction fragments analyzed on Southern blots are indicated by the horizontal lines, and the respective restriction enzyme sites are abbreviated as follows: B, BamHI; E, Eco32I; H, HindIII; and R, EcoRI. The probes used are shown as striped boxes. Below, the methylation status of HpaII sites in 12.5-dpc embryo DNAs is summarized. Each vertical line represents a single HpaII site (in a few cases, two inseparable sites). Methylation is given separately on the maternal (mat) and paternal (pat) alleles, where filled circles represent fully methylated, open circles represent unmethylated, and paired circles represent partially methylated. Those sites grouped in square brackets are all methylated or unmethylated, as indicated. For sites without symbols, methylation state could not be determined. Methylation status was also assayed for many Hin6I and Bsh1236I sites, which did not differ appreciably from that for HpaII, but is not shown for the sake of clarity. The methylation summary includes results from difference product clones (24). The AJ251761 sequence analyzed in Fig. 2B extends between the HindIII and EcoRI sites marked (∗); the outer BamHI (B) sites are situated at 82392 and 36822 in the sequence of mouse BAC RP23-439H2 (AL593857). (B) Representative Southern blots showing digests of 12.5-dpc MatDp(dist2) (Mat) and PatDp(dist2) (Pat) embryo DNAs hybridized with the probes indicated. DNAs are digested with the restriction enzymes indicated above each blot in combination with no other enzyme (lane 1), HpaII (lane 2), MspI (lane 3), Hin6I (lane 4), or Bsh1236I (lane 5).
FIG. 3.
FIG. 3.
Germ line and early embryo methylation of the Nespas-Gnasxl DMR. The features of the regions analyzed are indicated at the top. The Gnasxl exon is depicted as a bar with coding portion in black, untranslated in grey and direct repeats indicated by arrowheads; the Nespas exon 1 is an open box. The location of a MER DNA transposon is indicated by the stippled box. The approximate positions of HSSs present specifically on the paternal allele in ES cells are shown by vertical arrows (Fig. 6). Nucleotide positions are given according to sequence AJ251761. The extents of the PCR products sequenced after bisulfite modification of DNAs are represented by open bars labeled a to f. Methylation status is given below. Each line of circles represents an individual sequence molecule, with each circle corresponding to a separate CpG. Methylated CpGs are indicated by filled circles, nonmethylated CpGs by open circles. For PCR product d, the dot represents the position of a single-nucleotide polymorphism (5′-GGTCGG-3′ to 5′-GGTCTG-3′) found between C57BL/6J and CBA/Ca, which results in loss of the indicated CpG in the CBA/Ca sequence. Sperm DNA is from CBA/Ca and oocyte DNA from (C57BL/6J × CBA/Ca)F1s. Morula (M) and blastocyst (B) DNAs were obtained from an F1 × F1 cross, except for PCR product d, for which morulae were from a C57BL/6J × CBA/Ca cross, with maternal B6 allele sequences and paternal CBA allele sequences identified as mat and pat, respectively
FIG. 4.
FIG. 4.
DNase I hypersensitivity analysis of the Nesp region. (A) Analysis in nuclei from adult mouse kidney and brain, from (B6 × M. spretus) hybrids, in which the paternal allele is of M. spretus origin, and backcross (labeled spretus × B6) in which the maternal allele is M. spretus. Nuclei in the following lanes were digested with DNase I at the indicated concentrations: lane 1, 0 U/ml; lane 2, 50 U/ml; lane 3, 200 U/ml; lane 4, 400 U/ml; and lane 5, 750 U/ml. Purified DNA was digested with DraI and electrophoresed, and Southern blots were hybridized with probes D1 or D2. Maternal (M) and paternal (P) alleles are distinguished as a DraI RFLP. Points on the left of each blot represent DNA markers formed by DraI (D)-cut DNA digested with EcoRI (R), Eco32I (E), or XbaI (X). The M. spretus-specific DraI fragment is marked (∗D). Location of thesereference sites is given in C. DNase I cleavages are indicated by arrows to the right of the blots, weaker cleavages in grey, more prominent sites by the labeled black arrows. (B) Analysis in nuclei from ES cell lines (see text for description of cell lines). The key is the same as that for panel A, except that lanes marked H and M are untreated DNAs digested with DraI plus HpaII or MspI. (C) Interpretation of DNase I HSSs. The DraI fragment analyzed is shown, with nucleotide positions according to sequence AJ251761. Nesp exons are given as filled boxes, with coding portions in black and untranslated regions in grey; Nespas exons are given as open boxes. The locations of probes D1 and D2 are given as striped boxes. The approximate positions of HSSs are indicated by the vertical arrows and represent a summation of mapping with probes D1 and D2 in A and B and from additional blots (not shown).
FIG. 5.
FIG. 5.
DNase I hypersensitivity analysis of the Nespas-Gnasxl region in mouse tissues. (A) Analysis in nuclei from adult mouse brain and liver, from (B6 × M. spretus) hybrids, in which the paternal allele is M. spretus, and (M. spretus × B6) backcross, with maternal M. spretus. Nuclei were digested with DNase I (as in Fig. 4), purified DNA was digested with ScaI-XbaI and electrophoresed, and Southern blots were hybridized with probe SX2 or SX1. Maternal (M) and paternal (P) alleles are distinguished as a ScaI RFLP. Points on the left of the blots represent DNA markers formed by ScaI (Sc)-cut DNA digested with XbaI (X), EcoRI (R), HindIII (H), or Eco32I (E). The M. spretus-specific ScaI fragment is given (∗Sc). Location of these reference sites is shown in panel B. DNase I cleavages are indicated by arrows to the right of each blot, weaker cleavages in grey, more prominent sites in black. (B) Interpretation of DNase I HSSs. The ScaI-XbaI fragment analyzed is shown. The Gnasxl exon is given as the black box, with 5′ untranslated region in grey; the Nespas exon 1 is shown as the open box. The locations of probes SX1 and SX2 are given as striped boxes. The DNase I HSSs mapped from these and additional blots (not shown) are indicated using the convention above. HSSs on the maternal or paternal allele are labeled M or P, respectively.
FIG. 6.
FIG. 6.
DNase I analysis of the Nespas promoter region in ES cells. (A) Analysis of nuclei from SF1-1 (F1 × M. spretus) ES cells, using an EcoRI RFLP. Nuclei were digested with DNase I (as in Fig. 4), purified DNA was digested with EcoRI and electrophoresed, and Southern blots were hybridized with probes R1 and R2. Maternal (M) and paternal (P) alleles are indicated to the right of the blot. Points on the left of the blot represent DNA markers formed by EcoRI (R) cut DNA separately digested with HindIII (H), SacI (S) or TaqI (T). The M. spretus-specific EcoRI fragment is given as ∗R. Location of these reference sites is shown in D. DNase I cleavages are indicated by arrows to the right of each blot, weaker cleavages in grey, more prominent sites in black. Lanes marked H and M are untreated DNAs digested with EcoRI plus HpaII or MspI. (B) Similar analysis in nuclei from adult mouse brain (B6 × M. spretus hybrid). (C) Analysis using probe M1 in BamHI digested DNAs, for fine mapping of the ES cell-specific HSSs. Restriction site markers are BamHI (B), HindIII (H), NcoI (N), Eco32I (E) and TaqI (T). (D) Interpretation of DNase I HSSs. The start of the Gnasxl exon is represented as a filled box with 5′ untranslated region in grey, Nespas exon 1 as the open box. Locations of probes M1, R1 and R2 are given as striped boxes. The DNase I sites mapped from these and additional blots (not shown) are indicated using the convention above. HSSs on the maternal allele are labeled M, on the paternal allele P.
FIG. 7.
FIG. 7.
Epigenetic features and models of reciprocal imprinted expression of Nesp and Gnasxl. (A) Summary of epigenetic features. The Nesp, Nespas and Gnasxl exons are depicted as before. Above the line, the approximate locations of DNase I HSSs are marked by the vertical arrows, with thickness of arrow reflecting prominence of HSS, and are shown for maternal (mat) and paternal (pat) alleles in adult tissues and ES cells. Below the line, methylation status is summarized, in both gametes and embryonic tissues, with methylated regions (+) and unmethylated regions (−) marked. (B) Enhancer-boundary model for monoallelic expression of Nesp and Gnasxl. Methylated promoters are indicated (mmm). The open circle represents the position of hypothetical enhancers able to control the Nesp and Gnasxl promoters, and the diamond a methylation-sensitive boundary. Active promoters are indicated by the black arrows. (C) Antisense model. Expression of the Nespas antisense is indicated by the wavy line. See text for description of the models.

Similar articles

Cited by

References

    1. Arnaud, P., D. Monk, M. Hitchins, E. Gordon, W. Dean, C. V. Beechey, J. Peters, W. Craigen, M. Preece, P. Stanier, G. E. Moore, G. E., and G. Kelsey. 2003. Conserved methylation imprints in the human and mouse GRB10 genes with divergent allelic expression suggests differential reading of the same mark. Hum. Mol. Genet. 12:1005-1019. - PubMed
    1. Ball, S. T., C. M. Williamson, C. Hayes, T. Hacker, and J. Peters. 2001. The spatial and temporal expression pattern of Nesp and its antisense Nespas, in mid-gestation mouse embryos. Mech. Dev. 100:79-81. - PubMed
    1. Bastepe, M., J. E. Pincus, T. Sugimoto, K. Tojo, M. Kanatani, Y. Azuma, K. Kruse, A. L. Rosenbloom, H. Koshiyama, and H. Jüppner. 2001. Positional dissociation between the genetic mutation responsible for pseudohypoparathyroidism type 1b and the associated methylation defect at exon A/B: evidence for a long-range regulatory element within the imprinted GNAS1 locus. Hum. Mol. Genet. 10:1231-1241. - PubMed
    1. Bell, A. C., and G. Felsenfeld. 2000. Methylation of a CTCF-dependent boundary controls imprinted expression of the Igf2 gene. Nature 405:482-485. - PubMed
    1. Benson, G. 1999. Tandem Repeats Finder: a program to analyze DNA sequences. Nucleic Acids Res. 15:573-580. - PMC - PubMed

MeSH terms

LinkOut - more resources