. 2003 Aug;23(16):5556-71.
doi: 10.1128/MCB.23.16.5556-5571.2003.

Silencing of the novel p53 target gene Snk/Plk2 leads to mitotic catastrophe in paclitaxel (taxol)-exposed cells

Affiliations

Silencing of the novel p53 target gene Snk/Plk2 leads to mitotic catastrophe in paclitaxel (taxol)-exposed cells

Timothy F Burns et al. Mol Cell Biol. 2003 Aug.

Abstract

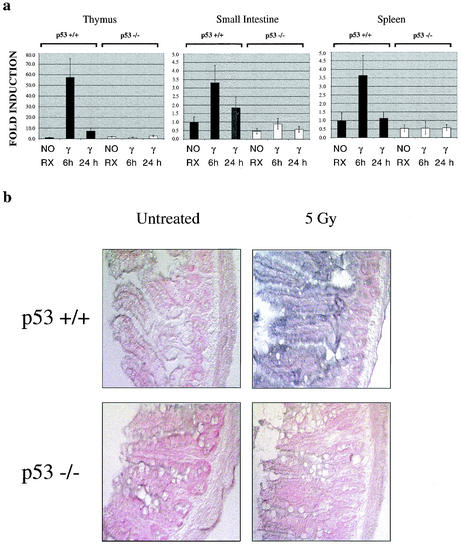
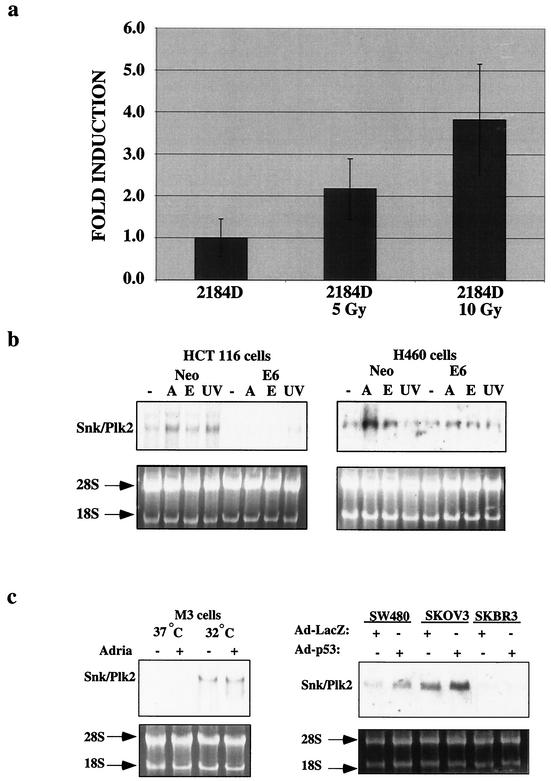
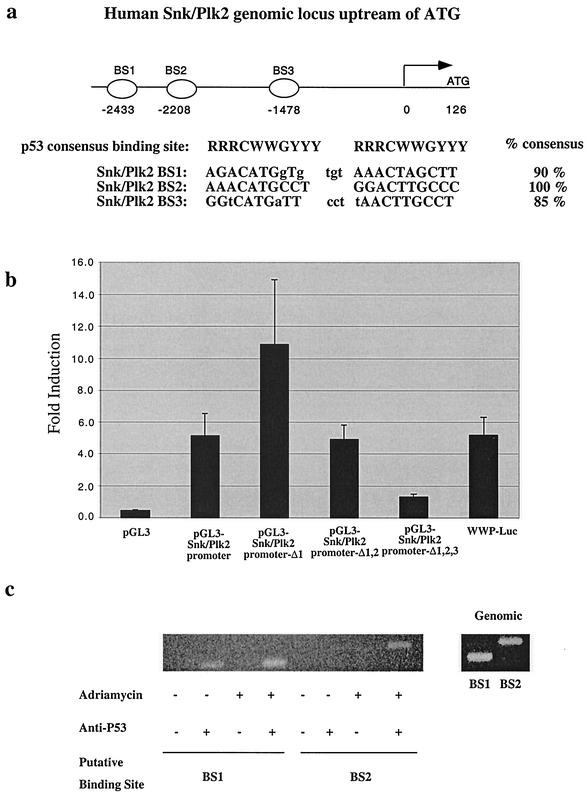
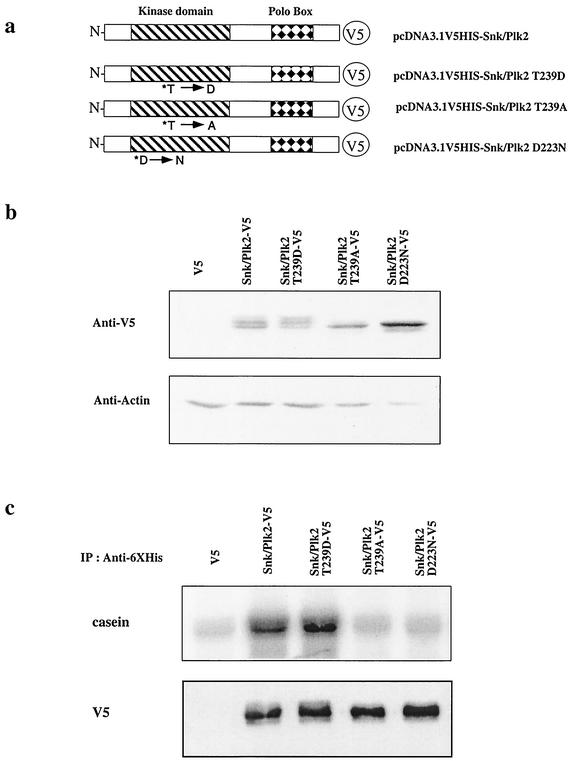
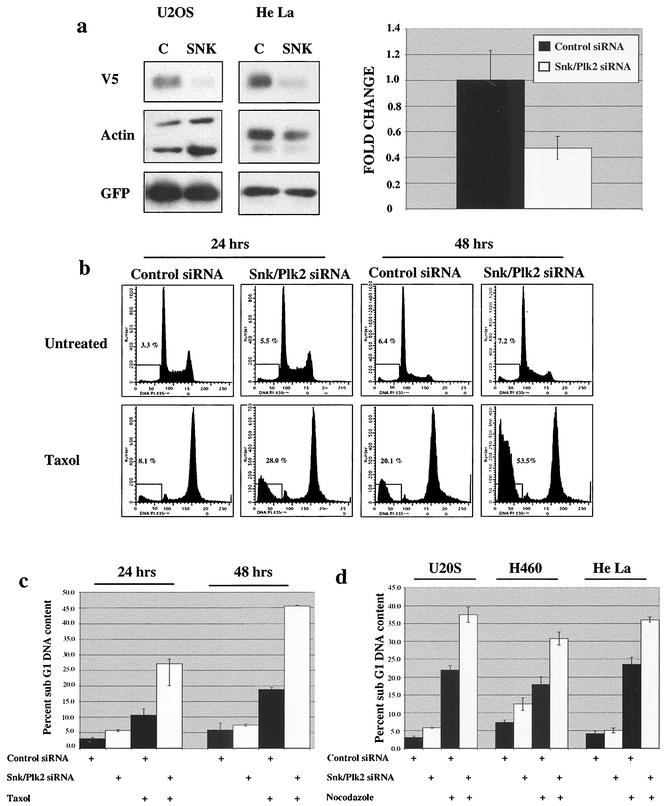
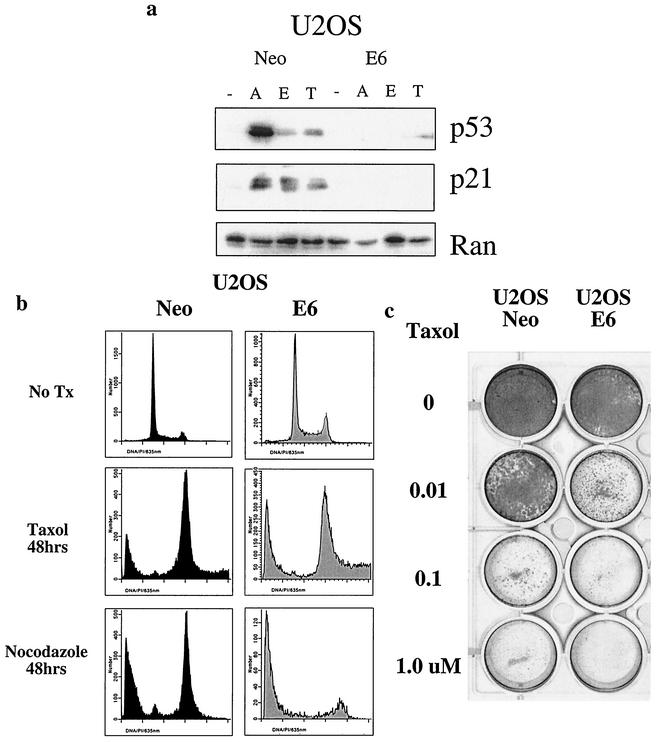
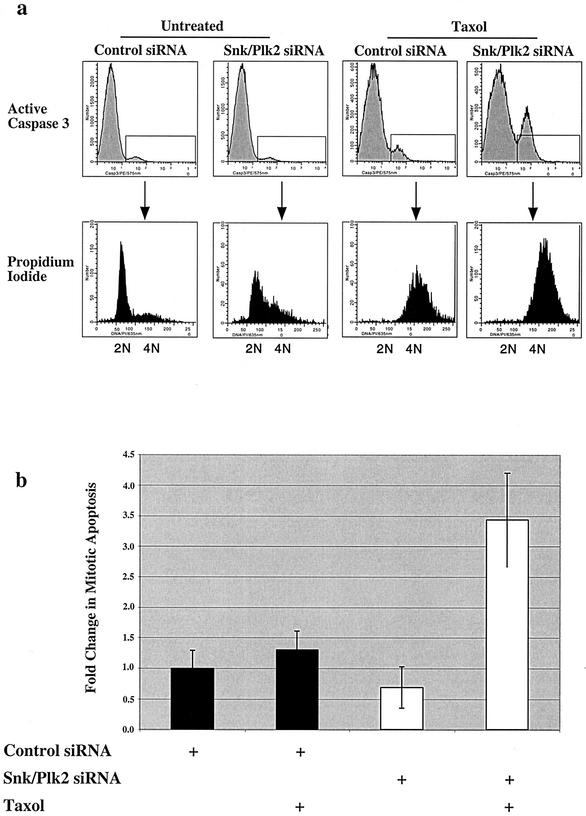
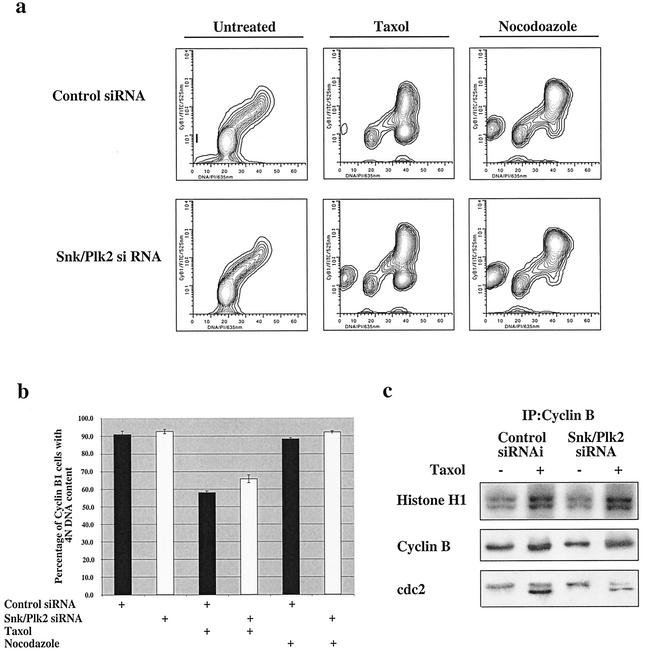
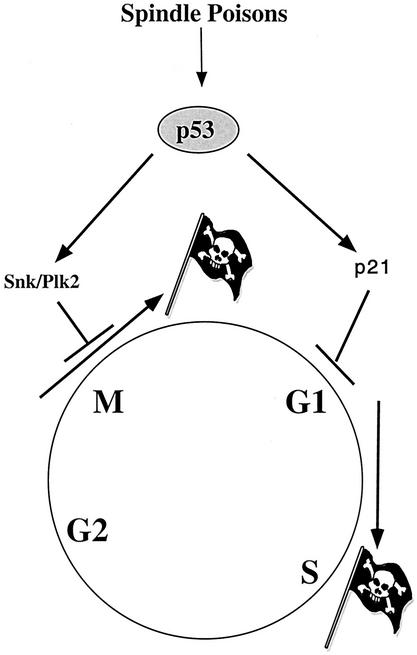
Loss of p53 sensitizes to antimicrotubule agents in human tumor cells, but little is known about its role during mitosis. We have identified the Polo-like kinase family member serum inducible kinase (Snk/Plk2) as a novel p53 target gene. Snk/Plk2 mutagenesis demonstrated that its kinase activity is negatively regulated by its C terminus. Small interfering RNA (siRNA)-mediated Snk/Plk2 silencing in the presence of the mitotic poisons paclitaxel (Taxol) or nocodazole significantly increased apoptosis, similar to p53 mutations, which confer paclitaxel sensitivity. Furthermore, we have demonstrated that the apoptosis due to silencing of Snk/Plk2 in the face of spindle damage occurs in mitotic cells and not in cells that have progressed to a G(1)-like state without dividing. Since siRNA directed against Snk/Plk2 promoted death of paclitaxel-treated cells in mitosis, we envision a mitotic checkpoint wherein p53-dependent activation of Snk/Plk2 prevents mitotic catastrophe following spindle damage. Finally, these studies suggest that disruption of Snk/Plk2 may be of therapeutic value in sensitizing paclitaxel-resistant tumors.


Figures

FIG. 1.
FIG. 1.
Snk/Plk2 is a p53 target gene in vivo. (a) mSnk/Plk2 mRNA expression in the thymus, small intestine, and spleen of wild-type (+/+) and p53 null (−/−) animals after irradiation (5 Gy). mRNA levels were determined by a TaqMan real-time quantitative RT-PCR assay. All expression levels were normalized to GAPDH in each well and are defined as the increases for samples relative to the level for p53+/+ untreated animals. NO RX, untreated animals. (b) In situ hybridization of irradiated ileum in wild-type (+/+) and p53 null (−/−) mice. The signal appears as blue or dark purple with pink or red counterstaining. Light microscopy images were taken using Nomarski optics (magnification, ×180).
FIG. 2.
FIG. 2.
Snk/Plk2 is a p53 target gene in response to DNA-damaging agents. (a) hSnk/Plk2 mRNA expression after ionizing radiation in the normal human diploid lymphoblastoid cell line 2184D. 2184D cells were untreated or exposed to irradiation at 5 or 10 Gy, and total RNA was harvested 10 h after treatment. mRNA levels were determined by a TaqMan real-time quantitative RT-PCR assay. All expression levels were normalized to GAPDH in each well and are defined as the increases for samples relative to the level for untreated 2184D cells. (b) HCT116 Neo and E6 cells and H460 Neo and E6 cells were untreated or treated with adriamycin (0.2 μg/ml) (A), 0.2 μM etoposide (E), or 50 J/m2 (UV), and total RNA was harvested 10 h after treatment. Northern blotting was performed for Snk/Plk2. An ethidium stain of the RNA confirms equivalent loading. (c) (Left panel) Mouse M3 lymphoma cells expressing mutant p53 (37°C) or wild-type p53 (32°C) were untreated or treated with adriamycin (0.2 μg/ml) and harvested after 10 h. Northern blotting was performed for mSnk/Plk2. (Right panel) Three mutant p53-expressing colon (SW480), ovarian (SKOV3), and breast cancer cell lines (SKBR3) were infected with either Ad-LacZ or Ad-p53, and total RNA was harvested 10 h after infection. Northern blotting was performed for Snk/Plk2. An ethidium stain of the RNA confirms equivalent loading.
FIG. 3.
FIG. 3.
The Snk/Plk2 promoter contains three p53 binding sites and is regulated by p53. (a) Schematic representation of the human Snk/Plk2 promoter region. Three p53 DNA binding sites are located at bp −2433 (BS1), bp −2208 (BS2), and bp −1478 (BS3) upstream from the start of transcription (indicated by arrow). An alignment of the p53 consensus binding element with the p53 binding sites present in the Snk/Plk2 promoter is shown. (b) pGL3-Snk/Plk2 promoter-Δ1, pGL3-Snk/Plk2 promoter-Δ1,2, or pGL3. Snk/Plk2 promoters were cotransfected (2.88 μg) with pCEP4 or pCEP4-p53 (0.72 μg) and pCMV-β-Gal (0.4 μg) into Saos2 cells. Luciferase activity was determined 24 h later. Empty vector (pGL3-Basic) and the p210WAF1 promoter (pWWP-Luc) were used as a negative and a positive control, respectively. Induction is indicated as levels for reporters with pCEP4-p53 divided by levels for reporters with pCEP4 (empty vector). (c) Adriamycin treatment enhances p53 binding to the Snk/Plk2 promoter in vivo. Untreated or adriamycin-treated U20S cells were harvested for chromatin immunoprecipitation as described in Materials and Methods. The left panel shows DNA that coprecipitated with the immunocomplexes and was amplified by PCR. The right panel shows amplification of genomic DNA using BS1 and BS2 primers.
FIG. 4.
FIG. 4.
Snk/Plk2 has kinase activity that is regulated by phosphorylation in its kinase domain. (a) Schematic of Snk/Plk2 mutants. Snk/Plk2 contains an N-terminal kinase domain and a C-terminal Polo box. Single-amino-acid residue substitutions in the kinase domain of conserved residues are indicated with an asterisk. Constructs contain a C-terminal V5-six-histidine tag. (b) 293 cells were transfected with the indicated Snk/Plk2 constructs or empty vector. At 24 h, the cells were harvested for protein and analyzed for expression with mouse anti-V5 antibody. Actin was used to confirm that an equivalent amount of protein was loaded in each lane. (c) 293 cells were transfected with the indicated Snk/Plk2 constructs or empty vector for 48 h. Equal amounts of 293 cell lysates (2.5 × 10⁶ cell equivalent) were harvested and immunoprecipitated with mouse monoclonal anti-polyhistidine agarose and subjected to Western blot analysis (lower panel) or an in vitro protein kinase assay (upper panel) using casein as a substrate. Lysates were immunoblotted for exogenously immunoprecipitated Snk/Plk2 using mouse monoclonal anti-V5-HRP.
FIG. 5.
FIG. 5.
Loss of Snk/Plk2 sensitizes tumor cells to spindle inhibitors through apoptosis. (a) (Left panel) U2OS cells and HeLa cells were transfected with Snk/Plk2 V5-six-histidine tag (4.5 μg), pEGFP (0.5 μg), and control siRNA duplex or Snk/Plk2 siRNA duplex (200 nmol). After 48 h, cells were harvested for protein and analyzed for expression with anti-V5 antibody. Green fluorescent protein was used to control for possible differences in transfection efficiencies. Actin was used as to confirm that an equivalent amount of protein was loaded in each lane. (Right panel) U2OS cells were transfected with control siRNA duplex or Snk/Plk2 siRNA duplex (300 nmol). After 48 h, cells were harvested for total RNA,and Snk/Plk2 mRNA levels were determined by a TaqMan real-time quantitative RT-PCR assay. All expression levels are normalized to GAPDH in each well, and changes are defined as levels of Snk/Plk2 mRNA with Snk/Plk2 siRNA duplex divided by levels of Snk/Plk2 mRNA with control siRNA duplex. (b) U2OS cells were transfected with control siRNA duplex or Snk/Plk2 siRNA duplex (300 nmol). Twenty-four hours after transfection, cells were treated with 1 μM paclitaxel. After 24 or 48 h of paclitaxel treatment, cells were harvested and collected for fluorescence-activated cell sorting analysis. Cell death was scored as the percentage of cells with a DNA content of less than 2N. (c) Quantitation of experiment in panel b. Depicted in the chart is one of several experiments each done in triplicate. (d) The osteosarcoma cell line U2OS, the non-small cell lung cancer cell line H460, and the cervical carcinoma cell line HeLa, were transfected with control siRNA duplex or Snk/Plk2 siRNA duplex (300 nmol). Twenty-four hours after transfection, cells were treated with nocodazole (1 μg/ml). After 24 h of treatment, cells were harvested and collected for fluorescence-activated cell sorting analysis. Cell death was scored as the percentage of cells with a DNA content of less than 2N. Depicted in the chart is one of several experiments, each done in triplicate.
FIG. 6.
FIG. 6.
Loss of p53 sensitizes tumor cells to spindle inhibitors. (a) U2OS Neo and E6 cells were untreated (−) or treated for 24 h with adriamycin (0.2 μg/ml) (A), 0.2 μM etoposide (E), or 1 μM paclitaxel (T). Western blot analysis of lysates was performed for p53 and p21. Ran was used as to confirm that an equivalent amount of protein was loaded in each lane. (b) U2OS Neo and E6 were treated with 1 μM paclitaxel or nocodazole (1 μg/ml). After 48 h cells were harvested and collected for fluorescence-activated cell sorting analysis. Cell death was scored as the percentage of cells with a DNA content of less than 2N. (c) U2OS Neo and E6 cells were plated at 2.4 × 10⁴ cells per well in a 12-well dish and treated with the indicated doses of paclitaxel for 24 h. After 24 h of treatment, the medium was removed and replaced with fresh medium without paclitaxel. Cells were grown for 7 days and then stained with Coomassie blue.
FIG. 7.
FIG. 7.
Loss of Snk/Plk2 leads to apoptosis during mitosis after treatment with antimicrotubule agents. (a) U2OS cells were transfected with control siRNA duplex or Snk/Plk2 siRNA duplex (300 nmol). Twenty-four hours after transfection, cells were treated with 1 μM paclitaxel. After a 24-h treatment, cells were harvested and stained for active caspase 3. Cells were also stained with propidium iodide to measure DNA content. The upper panel depicts active caspase 3 staining, while in the lower panel, DNA content of active caspase 3-positive cells was determined. (b) U2OS cells were transfected with control siRNA duplex or Snk/Plk2 siRNA duplex (300 nmol). Twenty-four hours after transfection, cells were treated with 1 μM paclitaxel. After 20 h of treatment, cells were harvested and stained for active caspase 3 and cyclin B. Cells were also stained with propidium iodide to measure DNA content. Depicted in the chart is the change in mitotic apoptosis (active caspase 3 positive, cyclin B positive, 4N DNA content) after paclitaxel treatment and siRNA directed against luciferase or Snk/Plk2. Changes are relative to untreated control siRNA. Depicted in the chart is one of several experiments, each performed in triplicate.
FIG. 8.
FIG. 8.
Loss of Snk/Plk2 does not lead to progression into anaphase or G1 phase after spindle inhibitors. (a) U2OS cells were transfected with control siRNA duplex or Snk/Plk2. siRNA duplex (300 nmol). Twenty-four hours after transfection, cells were treated with 1 μM paclitaxel or nocodazole (1.0 μg/ml). After a 24-h treatment, cells were harvested and stained for cyclin B1 expression. Cells were also stained with propidium iodide to measure DNA content. (b) Depicted in the chart is the percentage of cells with 4N DNA content that are cyclin B1 positive. Results are from one of several experiments each done in triplicate. (c) U2OS cells were transfected with control siRNA duplex or Snk/Plk2 siRNA duplex (300 nmol). Thirty-six hours after transfection, cells were treated with 1 μM paclitaxel. After 12 h, equal amounts of U2OS cell lysate were harvested and immunoprecipitated with mouse monoclonal anti-cyclin B1 antibody and subjected to Western blot analysis or an in vitro protein kinase assay using histone H1 as a substrate. Lysates were immunoblotted for cyclin B1 and cdc2.
FIG. 9.
FIG. 9.
Model of p53-dependent regulation of mitotic and G1 checkpoint after cellular exposure to antimicrotubule agents.

Similar articles

Cited by

References

    1. Abrieu, A., T. Brassac, S. Galas, D. Fisher, J. C. Labbe, and M. Doree. 1998. The Polo-like kinase Plx1 is a component of the MPF amplification loop at the G2/M-phase transition of the cell cycle in Xenopus eggs. J. Cell Sci. 111:1751-1757. - PubMed
    1. Ankathil, R., N. Geetha, P. Remani, V. P. Gangadharan, G. R. Pillai, and M. K. Nair. 1996. Clinical implications of cytogenetic classification in adult acute lymphoblastic leukaemia patients. J. Cancer Res. Clin. Oncol. 122:370-373. - PubMed
    1. Belge, G., L. Roque, J. Soares, S. Bruckmann, B. Thode, E. Fonseca, A. Clode, S. Bartnitzke, S. Castedo, and J. Bullerdiek. 1998. Cytogenetic investigations of 340 thyroid hyperplasias and adenomas revealing correlations between cytogenetic findings and histology. Cancer Genet. Cytogenet. 101:42-48. - PubMed
    1. Burns, T. F., E. J. Bernhard, and W. S. El-Deiry. 2001. Tissue specific expression of p53 target genes suggests a key role for KILLER/DR5 in p53-dependent apoptosis in vivo. Oncogene 20:4601-4612. - PubMed
    1. Burns, T. F., and W. S. El-Deiry. Microarray analysis of p53 target gene expression patterns in the spleen and thymus in response to ionizing radiation. Cancer Biol. Ther., in press. - PubMed

Publication types

MeSH terms