. 2003 Aug;23(16):5738-54.
doi: 10.1128/MCB.23.16.5738-5754.2003.

Mouse mammary tumor virus c-rel transgenic mice develop mammary tumors

Affiliations

Mouse mammary tumor virus c-rel transgenic mice develop mammary tumors

Raphaëlle Romieu-Mourez et al. Mol Cell Biol. 2003 Aug.

Abstract

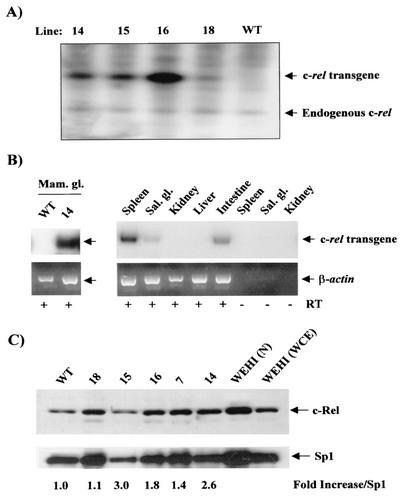
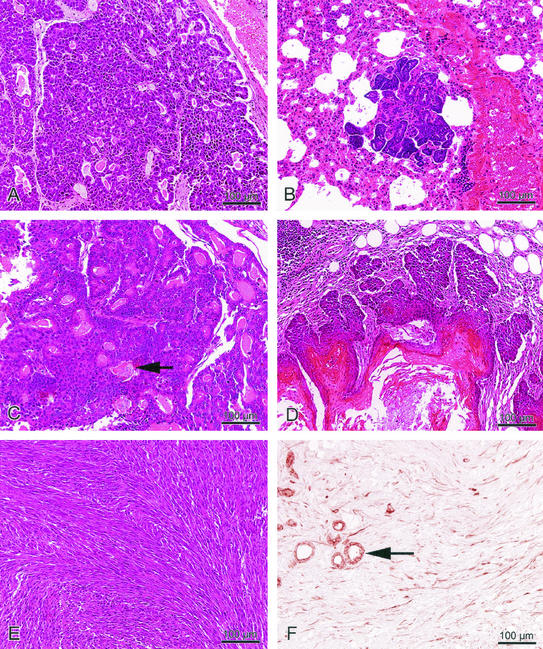
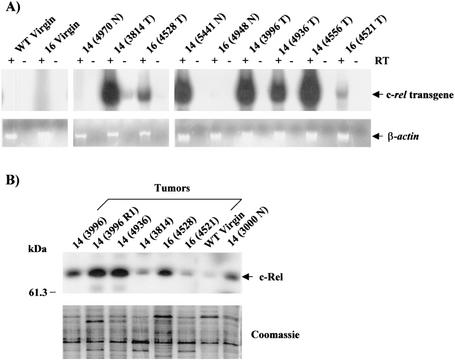
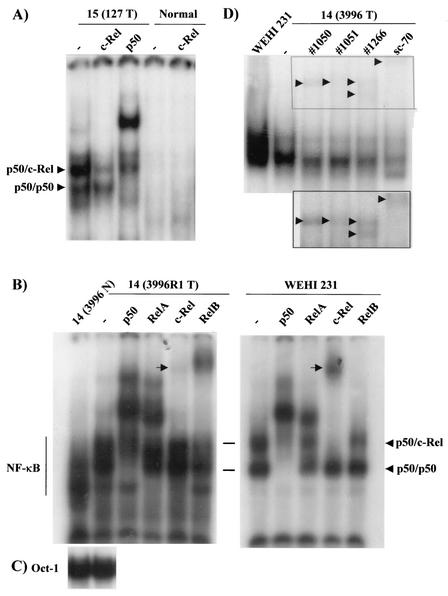
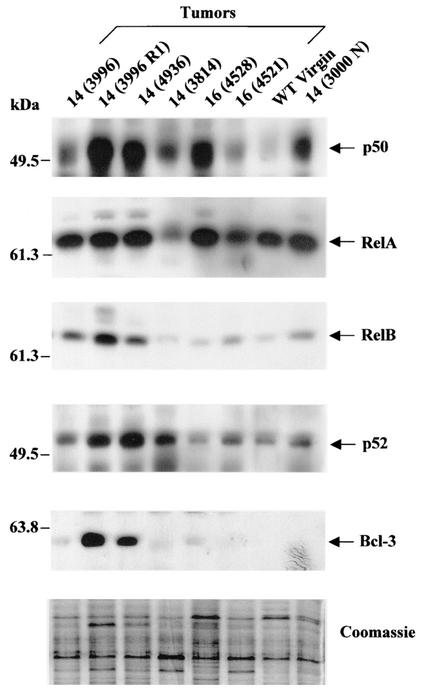
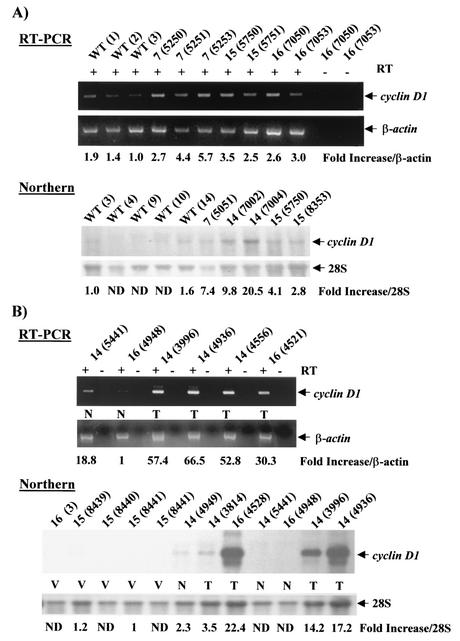
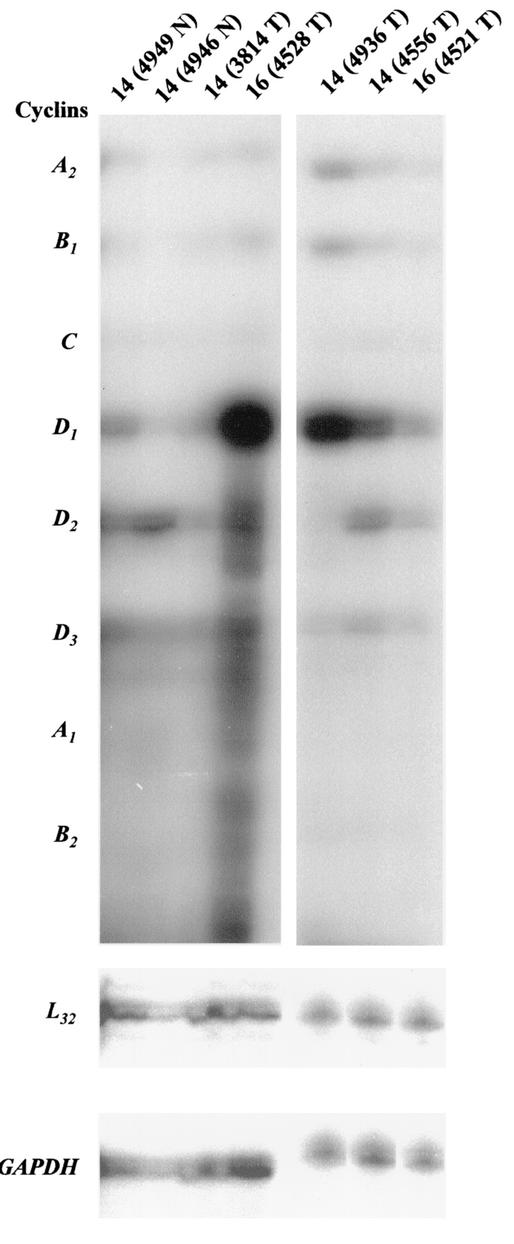
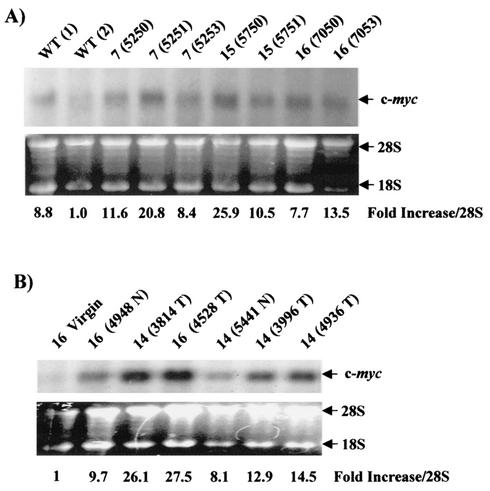
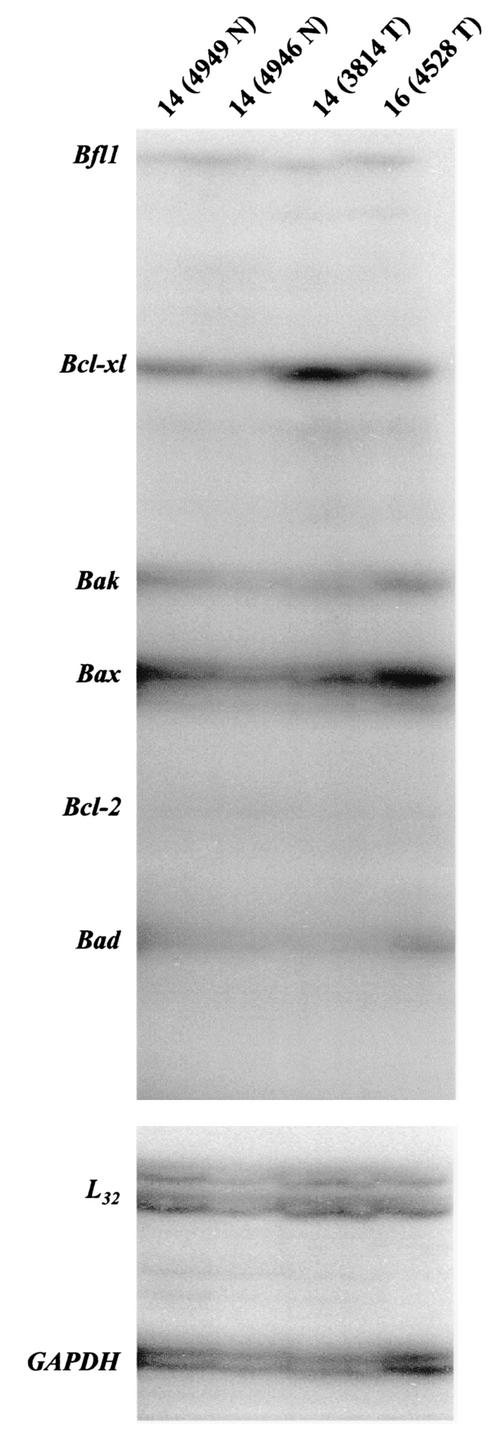
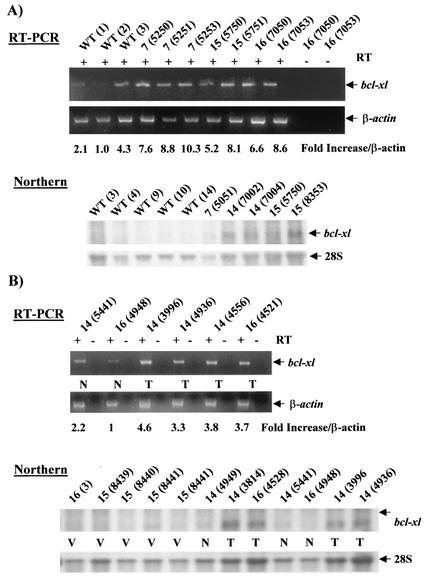
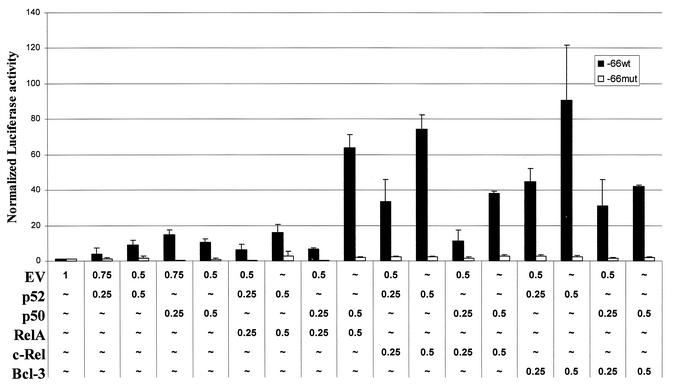
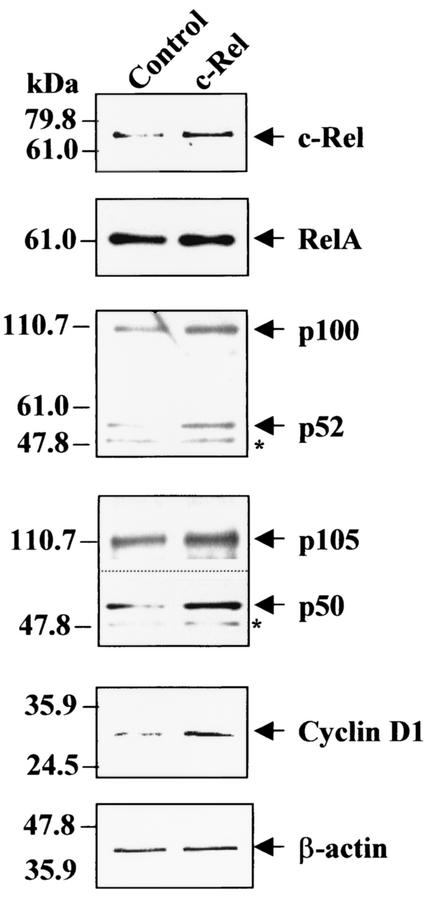
Amplification, overexpression, or rearrangement of the c-rel gene, encoding the c-Rel NF-kappaB subunit, has been reported in solid and hematopoietic malignancies. For example, many primary human breast cancer tissue samples express high levels of nuclear c-Rel. While the Rev-T oncogene v-rel causes tumors in birds, the ability of c-Rel to transform in vivo has not been demonstrated. To directly test the role of c-Rel in breast tumorigenesis, mice were generated in which overexpression of mouse c-rel cDNA was driven by the hormone-responsive mouse mammary tumor virus long terminal repeat (MMTV-LTR) promoter, and four founder lines identified. In the first cycle of pregnancy, the expression of transgenic c-rel mRNA was observed, and levels of c-Rel protein were increased in the mammary gland. Importantly, 31.6% of mice developed one or more mammary tumors at an average age of 19.9 months. Mammary tumors were of diverse histology and expressed increased levels of nuclear NF-kappaB. Analysis of the composition of NF-kappaB complexes in the tumors revealed aberrant nuclear expression of multiple subunits, including c-Rel, p50, p52, RelA, RelB, and the Bcl-3 protein, as observed previously in human primary breast cancers. Expression of the cancer-related NF-kappaB target genes cyclin D1, c-myc, and bcl-xl was significantly increased in grossly normal transgenic mammary glands starting the first cycle of pregnancy and increased further in mammary carcinomas compared to mammary glands from wild-type mice or virgin transgenic mice. In transient transfection analysis in untransformed breast epithelial cells, c-Rel-p52 or -p50 heterodimers either potently or modestly induced cyclin D1 promoter activity, respectively. Lastly, stable overexpression of c-Rel resulted in increased cyclin D1 and NF-kappaB p52 and p50 subunit protein levels. These results indicate for the first time that dysregulated expression of c-Rel, as observed in breast cancers, is capable of contributing to mammary tumorigenesis.


Figures

FIG. 1.
FIG. 1.
MMTV-LTR-driven c-rel transgene expression in FVB/N mice. (A) Identification of founder lines. Genomic tail DNA was prepared from the indicated potential founders MMTV-c-rel transgenic mice, and samples (10 μg) digested with PstI and subjected to Southern blot analysis for c-rel using the 2.2-kb fragment, encompassing the MMTV-LTR promoter and an ∼1-kb fragment of mouse c-rel cDNA, released from the MMTV-c-rel plasmid digested with PstI, as a probe. The positions of the bands derived from the c-rel transgene and the endogenous c-rel gene are as indicated. (B) Transgenic c-rel expression. Total RNA was isolated from the indicated organs of WT FVB/N or line14 MMTV-c-rel mice at day 18.5 of the first pregnancy, and subjected to DNase treatment. Samples (5 μg) were subjected to RT-PCR analysis, in the presence (+) or absence (−) of RT to control for DNA contamination, using c-rel transgene-specific oligonucleotides, amplifying a 236-bp fragment. Similar analysis of β-actin RNA levels confirmed the integrity of the reverse transcription reaction. (C) Total c-Rel expression. Mammary glands were removed from WT FVB/N or the indicated transgenic line mice at day 18.5 of the first pregnancy. Nuclear extract were prepared, and samples (20 μg) subjected to immunoblot analysis of c-Rel, and Sp1, as control for loading. As additional controls, nuclear extracts and WCEs from the WEHI 231 immature B-lymphoma cells, which express high constitutive levels of c-Rel (40), were similarly analyzed. The values of c-Rel normalized to Sp1 level relative to the WT sample are displayed below.
FIG. 2.
FIG. 2.
Representative histopathologies of mammary tumors that developed in MMTV-c-rel transgenic mice after multiple cycles of pregnancy and regression. (A) Adenocarcinoma; (B) pulmonary metastasis in a mouse with mammary adenocarcinomas; (C) adenosquamous carcinoma showing areas with extracellular squamous differentiation (arrow); (D) squamous cell carcinoma; (E) spindle cell carcinoma; (F) immunohistochemistry for cytokeratin 8 expression in the spindle cell carcinoma shown in 2E. Note the staining of many of the spindle cells and staining of luminal epithelium in the glands (arrow).
FIG. 3.
FIG. 3.
Expression of c-Rel in transgenic female MMTV-c-rel breast tumors. Mammary glands were removed from virgin WT FVB/N (WT Virgin) or transgenic line 16 (16 Virgin) mice and from tumor (T) and grossly normal (N) tissues of multiparous line 14 and 16 transgenic mice. The identification number given to the individual mice is indicated in parentheses. Characteristics of the tumor samples are given in the Table 1. (A) Transgenic c-rel expression. RNA was prepared from mammary gland and tumor tissues, and samples subjected to RT-PCR with primers specific for transgenic c-rel, as in the legend to Fig. 1. (B) Total protein c-Rel expression. Nuclear extracts were prepared, and samples (40 μg) subjected to immunoblot analysis of c-Rel levels. Coomassie blue staining of SDS-PAGE gels was used as control for equal loading (bottom panel). While the overall levels of staining were essentially equivalent, the analysis revealed that the patterns of protein expression are different between tumors, WT and normal transgenic mammary gland samples. This variability likely results from differences in cell type composition in these tissues.
FIG. 4.
FIG. 4.
MMTV-c-rel tumors display elevated NF-κB binding. (A) Nuclear extracts were prepared from MMTV-c-rel line 15 (127) mouse mammary tumor and grossly normal mammary glands, and samples (5 μg) subjected to EMSA for NF-κB binding. To identify subunit composition, the indicated samples were incubated overnight at 4°C in the absence (−) or the presence of a supershifting antibody specific for p50, or a blocking antibody specific for c-Rel. The positions of the identified p50/c-Rel and p50 homodimer complexes are as indicated. (B and C) Nuclear extracts were prepared from line 14 3996 mammary tumor (3996R1 T) and grossly normal mammary glands (N), and samples (5 μg) were subjected to EMSA for NF-κB (B) and, as a loading control, Oct-1 (C). For supershift analysis, samples were incubated overnight at 4°C in the absence (−) or the presence of supershifting antibodies specific for p50, RelA, c-Rel (sc-70), and RelB. The arrow shows the position of the c-Rel supershifted complex. Where indicated, nuclear extracts (5 μg) of WEHI 231 B cells, which express high levels of c-Rel/p50 complexes (40), were analyzed as a positive control in the same experiment, however a lighter exposure is shown for the WEHI 231 samples. (D) A nuclear extract was prepared from line 14 3996 mammary tumor (3996 T), and samples (5 μg) were subjected to EMSA for NF-κB, with a WEHI 231 nuclear extract, in the absence or presence of the indicated c-Rel-specific antibodies, as above. Inset represents a darker exposure of the region of the supershifted bands indicated in the figure.
FIG. 5.
FIG. 5.
MMTV-c-rel tumors express multiple NF-κB subunits and the Bcl-3 protein. Nuclear extracts were prepared from the indicated mammary tumors, grossly normal mammary glands (N) of multiparous line 14 MMTV-c-rel mice, and from mammary glands of a WT nulliparous FVB/N mouse (WT Virgin). Samples (40 μg), subjected to immunoblot analysis as in Fig. 3B, were reprobed for expression of the p50, RelA, RelB, and p52 NF-κB subunits and the Bcl-3 protein. The positions of molecular mass markers are indicated.
FIG. 6.
FIG. 6.
MMTV-c-rel mammary glands and carcinomas overexpress cyclin D1 mRNA. (A) Mammary glands. Total RNA was prepared from mammary glands of 3- to 6-month-old mice or WT FVB/N mice at day 18.5 of the first pregnancy. RT-PCR: RNA was subjected to DNase treatment, and analysis on ethidium bromide stained gels verified quality and essentially equal loading (data not shown). Samples (5 μg) were subjected to RT-PCR analysis of cyclin D1 and β-actin mRNA levels in the presence (+) or absence (−) of RT to control for DNA contamination. For the β-actin mRNA analysis, levels appeared saturated after 30 cycles of PCR and identical in all of the samples tested, while levels were undetectable below 20 PCR cycles (data not shown), so 25 PCR cycles was selected for normalization. The values of cyclin D1 signal intensity normalized to β-actin mRNA levels are presented relative to the WT (3) sample. RNA samples (5 μg) were subjected to Northern blot analysis of cyclin D1 gene levels using a radiolabeled human full-length cyclin D1 cDNA as probe. Ethidium bromide staining of the 28S rRNA was used as a control for loading. The values of cyclin D1 signal normalized to 28S rRNA relative to WT (3) are given below. ND, not detectable by scanning. (B) Mammary carcinomas. Total RNA was prepared from the indicated mammary tumors (T) and grossly normal mammary glands (N) of age-related multiparous line 14 and 16 MMTV-c-rel mice, as well as from virgin (V) transgenic mouse mammary glands. RNA samples (5 μg) were subjected to semiquantitative RT-PCR analysis to assess cyclin D1 mRNA levels, as described above. The values of cyclin D1 signal intensity normalized to β-actin RNA levels are presented relative to the line 16 (4948 N) normal sample (which was better seen on a darker exposure). RNA samples (5 μg) were subjected to Northern blot analysis to assess cyclin D1 mRNA levels, as described above. The values of cyclin D1 signal normalized to 28S rRNA relative to 15 (8441) are given below. ND, not detectable by scanning.
FIG. 7.
FIG. 7.
Profile of cyclin gene expression in MMTV-c-rel mouse mammary glands and tumors. Total RNA was prepared from the indicated mammary tumors (T) or grossly normal mammary glands (N) of age-related multiparous line 14 and 16 MMTV-c-rel mice. RNA samples (5 μg) were subjected to RPA analysis to assess mRNA levels for cyclin A1, A2, B1, B2, C, D1, D2, and D3, and L32 and GAPDH housekeeping genes. Data from two sets of analyses are shown in the left and right panels. The identities of the RNase protected bands were established using the undigested probes as markers and a control RNA for mouse cyclin mRNA expression provided with the kit (data not shown).
FIG. 8.
FIG. 8.
MMTV-c-rel tumors overexpress c-myc mRNA. (A) Mammary glands. Total RNA was prepared from mammary glands and samples (15 μg) subjected to Northern analysis for c-myc mRNA expression. As a control, the gel was stained with ethidium bromide, shown below. The relative values of c-myc signal intensity normalized to levels of 28S rRNA are given relative to the WT (2) virgin sample. (B) Mammary tumors. Total RNA was extracted from the indicated mammary tumors (T) and grossly normal mammary glands (N) of age-related multiparous line 14 and 16 MMTV-c-rel mice. In addition, RNA was isolated from mammary glands of a nulliparous transgenic line 16 mouse (16 Virgin). RNA samples (20 μg) were subjected to Northern analysis for c-myc mRNA expression. As controls for RNA integrity and equal loading, the gel was stained with ethidium bromide, and RNA samples subjected to RT-PCR analysis for β-actin mRNA levels (Fig. 3). The values of c-myc signal intensity normalized to 28S rRNA levels relative to the line 16 virgin sample are given below.
FIG. 9.
FIG. 9.
Profile of Bcl-2 family member gene expression in MMTV-c-rel mouse mammary glands and tumors. RNA was prepared from the indicated mammary tumors (T) and grossly normal mammary glands (N) of age-related multiparous line 14 and 16 MMTV-c-rel mice. Samples (5 μg) were subjected to RPA analysis to assess mRNA levels of Bcl-2 family member genes, i.e., bfl-1/a1, bcl-xl, bax, bak, bcl-2, and bad, and L32 and GAPDH housekeeping genes. The identity of the RNase protected bands were established using the undigested probes as markers and a control RNA for mouse apoptosis gene expression provided with the kit (data not shown).
FIG. 10.
FIG. 10.
MMTV-c-rel mammary glands and carcinomas overexpress bcl-xl mRNA. (A) Mammary glands. Total RNA was prepared from the indicated 3- to 6-month-old transgenic mice and WT FVB/N at day 18.5 of the first pregnancy. RT-PCR: Samples (5 μg) were subjected to RT-PCR analysis of bcl-xl and β-actin mRNA levels, as described above in Fig. 6. The values of bcl-xl signal intensity normalized to β-actin mRNA levels are presented relative to the WT (2) sample. Northern blot: Samples (5 μg) were subjected to Northern blot analysis of bcl-xl mRNA levels, using a mouse bcl-xl cDNA as a probe, as described above in Fig. 6. The values of the bcl-xl signals for the WT samples were below the level of detection. (B) Mammary carcinomas. Total RNA was prepared from the indicated mammary glands (virgin [V] or multiparous grossly normal [N]) or tumors (T), and samples (5 μg) were subjected to either semiquantitative RT-PCR or Northern blot analysis to assess mRNA levels for bcl-xl, as described above. The values of bcl-xl signal intensity normalized to β-actin mRNA levels in the RT-PCR analysis are presented relative to the line 16 (4948) normal sample, while the bcl-xl signals in the Northern blot analysis for the virgin and normal samples were below the level of detection.
FIG. 11.
FIG. 11.
c-Rel heterodimer complexes induce the cyclin D1 promoter. NMuMG cells were transfected, in duplicate, with −66 WT-cyclin D1 or −66 Mut-cyclin D1 luciferase gene reporter constructs and 0.5 μg of pSV40-β-gal in the presence of the indicated amounts of NF-κB or Bcl-3 plasmid expression vectors. After 48 h, cultures were harvested, normalized for β-Gal activity, and assayed for luciferase activity. Normalized values of luciferase activity are presented (error bars, standard deviations).
FIG. 12.
FIG. 12.
Ectopic c-Rel expression in human MCF-10F untransformed mammary epithelial cells induces levels of cyclin D1, and p52 and p50 expression. Cells were cotransfected with pSVSport-c-Rel (c-Rel) and pGKpuro plasmid expression vectors, and a mixed population of cells was selected with puromycin. WCEs were prepared from transfected cells and parental untransfected cells (Control), and samples (10 μg) were subjected to immunoblot analysis for c-Rel, RelA, p52/p100, p50/p105, cyclin D1, and β-actin levels using two identical blots that were successively reprobed with the different antibodies. To better visualize the p105 versus p50 band, a longer exposure was used.

Similar articles

Cited by

References

    1. Abbadie, C., N. Kabrun, F. Bouali, J. Smardova, D. Stehelin, B. Vandenbunder, and P. J. Enrietto. 1993. High levels of c-rel expression are associated with programmed cell death in the developing avian embryo and in bone marrow cells in vitro. Cell 75:899-912. - PubMed
    1. Alizadeh, A. A., M. B. Eisen, R. E. Davis, C. Ma, I. S. Lossos, A. Rosenwald, J. C. Boldrick, H. Sabet, T. Tran, X. Yu, J. I. Powell, L. Yang, G. E. Marti, T. Moore, J. Hudson, Jr., L. Lu, D. B. Lewis, R. Tibshirani, G. Sherlock, W. C. Chan, T. C. Greiner, D. D. Weisenburger, J. O. Armitage, R. Warnke, L. M. Staudt, and et al. 2000. Distinct types of diffuse large B-cell lymphoma identified by gene expression profiling. Nature 403:503-511. - PubMed
    1. Arsura, M., M. J. FitzGerald, N. Fausto, and G. E. Sonenshein. 1997. Nuclear factor-κB/Rel blocks transforming growth factor beta1-induced apoptosis of murine hepatocyte cell lines. Cell Growth Differ. 8:1049-1059. - PubMed
    1. Arsura, M., F. Mercurio, A. L. Oliver, S. S. Thorgeirsson, and G. E. Sonenshein. 2000. Role of the IκB kinase complex in oncogenic Ras- and Raf-mediated transformation of rat liver epithelial cells. Mol. Cell. Biol. 20:5381-5391. - PMC - PubMed
    1. Arsura, M., and G. E. Sonenshein. 2001. The roles of the c-myc and c-myb oncogenes in hematopoiesis and leukemogenesis, p. 521-549. In K. Ravid and J. Licht (ed.), Transcription factors: normal and malignant development of blood cells. Wiley-Liss Inc., New York, N.Y.

Publication types

MeSH terms

LinkOut - more resources