. 2003 Aug;23(16):5755-67.
doi: 10.1128/MCB.23.16.5755-5767.2003.

Xeroderma pigmentosum group A protein loads as a separate factor onto DNA lesions

Affiliations

Xeroderma pigmentosum group A protein loads as a separate factor onto DNA lesions

Suzanne Rademakers et al. Mol Cell Biol. 2003 Aug.

Abstract

Nucleotide excision repair (NER) is the main DNA repair pathway in mammals for removal of UV-induced lesions. NER involves the concerted action of more than 25 polypeptides in a coordinated fashion. The xeroderma pigmentosum group A protein (XPA) has been suggested to function as a central organizer and damage verifier in NER. How XPA reaches DNA lesions and how the protein is distributed in time and space in living cells are unknown. Here we studied XPA in vivo by using a cell line stably expressing physiological levels of functional XPA fused to green fluorescent protein and by applying quantitative fluorescence microscopy. The majority of XPA moves rapidly through the nucleoplasm with a diffusion rate different from those of other NER factors tested, arguing against a preassembled XPA-containing NER complex. DNA damage induced a transient ( approximately 5-min) immobilization of maximally 30% of XPA. Immobilization depends on XPC, indicating that XPA is not the initial lesion recognition protein in vivo. Moreover, loading of replication protein A on NER lesions was not dependent on XPA. Thus, XPA participates in NER by incorporation of free diffusing molecules in XPC-dependent NER-DNA complexes. This study supports a model for a rapid consecutive assembly of free NER factors, and a relatively slow simultaneous disassembly, after repair.


Figures

FIG. 1.
FIG. 1.
Functionality of GFP-XPA. (A) Schematic representation of the His9-HA-eGFP-XPA fusion gene with the different binding domains indicated. NLS, nuclear localization signal; BD, binding domain; aa, amino acids. (B) Fluorescence image of XP-A cells injected with GFP-tagged XPA cDNA. Only the multinucleated cell microinjected with GFP-XPA cDNA showed a homogeneous nuclear expression (number 1); surrounding cells were not injected (number 2). (C) Measurement of the repair capacity of cells with fluorescent nuclei by means of UV-induced UDS (see Materials and Methods). The amount of silver grains above the nuclei of the injected cells (number 1) was comparable to what was seen with wild-type cells (not shown), whereas the surrounding XP-A fibroblasts (number 2) show the low level of DNA synthesis typical for UV-exposed XP-A cells. The cell indicated with the number 3 is in S phase.
FIG. 2.
FIG. 2.
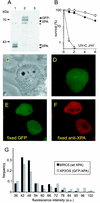
Expression and characterization of XP2OS cells stably expressing GFP-tagged XPA. (A) Immunoblot of 30 μg of whole-cell extract from MRC5 (wild-type) (lane 1), GFP-XPA-transfected XP2OS (clone 40) (lane 2), and XP2OS (XP-A) (lane 3) cells probed with polyclonal anti-XPA. The molecular masses of protein markers are indicated in kilodaltons. No XPA protein was detected in XP2OS cells because of a G-C transversion in the splicing acceptor site in intron 3 of the XPA gene. The asterisk indicates a nonspecific cross-reacting band. (B) UV survival of repair-proficient MRC5 cells (□), clone 40 (▪), and XP2OS cells (▵) (see Materials and Methods). The transfected cell line shows a wild-type correction of the XP-A-specific UV sensitivity. (C) Phase-contrast image of a living clone 40 cell. (D) Epifluorescence GFP image of the same cell as in panel C, showing a homogeneous nuclear distribution. (E) Fluorescence image after fixation of clone 40, showing a similar distribution as in panel D. (F) Immunofluorescence of the same cell as in panel E incubated with anti-XPA serum, showing a similar XPA distribution as with GFP fluorescence, except for the nucleoli. (G) Expression profiles of XPA (black bars) and GFP-XPA (gray bars) in MRC5 cells and clone 40, respectively, after immunofluorescence staining with XPA antibodies. GFP-XPA cells exhibiting an expression level similar to the major peak of XPA expression in MRC5 cells were used in further experiments.
FIG. 3.
FIG. 3.
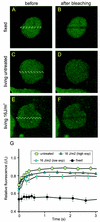
Temporal FRAP analysis applied on GFP-XPA-expressing cells to determine the immobile fraction after UV irradiation. Shown are confocal images and corresponding FRAP profiles. The dotted line indicates the position of the photobleaching strip. To determine a potential immobile fraction, the mean intensity immediately before bleaching was set as 1 and the fluorescence intensity immediately after bleaching was set as 0. (A and B) Pre- and postbleach images, respectively, of fixed cells, showing complete immobilization of GFP-XPA. (C and D) Images of living cells monitored during FRAP, with panel D showing a homogeneous bleaching throughout the nucleus 4 s after the bleach pulse. (E and F) Images of living cells irradiated with 8-J/m2 UV-C. Note that the UV-irradiated cell (F) shows an intermediate pattern between those of untreated (D) and fixed (B) cells. (G) Fluorescence recovery profile expressed as relative fluorescence plotted against time after bleaching. Each plot is the mean value for at least 50 cells (fixed cells, untreated living cells, UV-irradiated cells expressing relatively low levels of GFP-XPA, and UV-irradiated cells expressing high levels of GFP-XPA). The immobile fraction can be calculated by measuring the reduction of fluorescence recovery compared with nonirradiated cells.
FIG. 4.
FIG. 4.
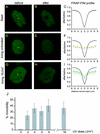
FRAP-FIM method applied to GFP-XPA-expressing cells. Shown are confocal images and corresponding fluorescence ratio profiles (FRP) of 50 cells. (A and B) Pre- and postbleach images, respectively, of cells fixed with 2% paraformaldehyde, displaying the immobilization of GFP-XPA molecules after fixation, visualized by the intense bleached spot and high fluorescence intensity outside the bleached spot (B). (C) FRP of fixed cells. (D and E) Images of living untreated cells, showing an overall reduction of fluorescence after the bleach pulse (E). (F) FRP of untreated cells (green line). (G and H) Image of cells irradiated with 8-J/m2 UV-C. The UV-irradiated cell (H) displays a distribution pattern intermediate of those of untreated (B) and fixed (E) cells. The “X” in panels A, D, and G represents the position of the bleach pulse. (I) FRP of UV-irradiated cells (blue line). (J) Response of GFP-XPA immobilization to different UV doses.
FIG. 5.
FIG. 5.
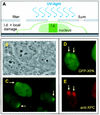
Accumulation of GFP-XPA within restricted nuclear areas after local UV irradiation. (A) Schematic presentation of local UV damage infliction on living cultured cells. (B and C) Micrographs (phase-contrast image [B] and fluorescence image [C]) of living cells expressing GFP-XPA (clone 40) and UV irradiated through a filter with small (5-μm-diameter) pores. The arrows in panel C point to the local accumulations of GFP-XPA. (D and E) GFP-XPA accumulations (arrows) shown in panel D clearly colocalize with endogenous XPC (E) concentrations, as determined with anti-XPC antibodies, in fixed cells.
FIG. 6.
FIG. 6.
Application of FLIP, using locally damaged cells, to determine the binding time of GFP-XPA molecules on damaged DNA. (A) Confocal images of a locally UV-damaged GFP-XPA-expressing cell (clone 40). Shown are images before application of a bleach pulse and at 20 s, 3 min, and 6 min after bleaching. (B) Fluorescence profile as a function of time; residence time was estimated to be ∼4 to 6 min, the time at which the relative fluorescence difference between damaged area and background is established to be <10% of the initial (prebleach) situation. The inset shows the application of the FLIP procedure in local damaged cells: a laser beam is focused (between dotted lines) opposite to the damaged area (arrow) (a typical example is shown in panel A).
FIG. 7.
FIG. 7.
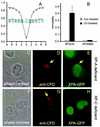
Effect of XPC on damage-induced XPA immobility as analyzed by FRAP-FIM and local damage induction. (A) FRAP-FIM profile of GFP-XPA expression in XP20MA (XP-C) cells. Shown are results for nonirradiated cells (light green line), cells irradiated at 16 J/m2 (blue line), and fixed cells (black line). UV-exposed XP20MA cells do not show any GFP-XPA immobilization. (B) Quantification of immobilization of GFP-XPA in XP20MA and XP2OS cells with and without UV irradiation. (C) Phase-contrast image of GFP-XPA-expressing XP2OS cells. (D) Anti-CPD immunostaining in a GFP-XPA-expressing XP2OS cell. The arrow indicates the site of the damage. (E) GFP image of the same cell as in panel D, showing enrichment of GFP-XPA at the damaged site. (F) Phase-contrast image of GFP-XPA-expressing XP20MA cells. (G) Anti-CPD immunostaining of a GFP-XPA-expressing XP20MA cell, indicated by the arrow. (H) GFP image showing no enrichment of GFP-XPA molecules.
FIG. 8.
FIG. 8.
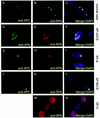
Relocalization of RPA to the NER complex 30 min after local irradiation with 25-J/m2 UV. (A to C) Anti-XPC (A) and anti-RPA (B) immunostaining of VH25 cells and the merged image after immunostainings plus DAPI nuclear DNA staining (C). (D to F) Anti-XPA (D) and anti-RPA (E) immunostaining of XPCS1RO cells and the merged image after immunostainings plus DAPI nuclear DNA staining (F). (G to I) Anti-XPC (G) and anti-RPA (H) immunostaining of XP25RO cells and the merged image after immunostainings plus DAPI nuclear DNA staining. (J to L) Anti-XPC (J) and anti-RPA (K) staining of XP131MA cells and the merged image after immunostainings plus DAPI nuclear DNA staining (L). (M and N) Anti-RPA immunostaining of XP21RO cells (M) and the merged image after immunostaining plus DAPI nuclear DNA staining (N). The yellow color in the merged images in panels C, F, I, and L indicates colocalization of NER proteins at sites of locally induced DNA damages.

Similar articles

Cited by

References

    1. Aboussekhra, A., M. Biggerstaff, M. K. K. Shivji, J. A. Vilpo, V. Moncollin, V. N. Podust, M. Protic, U. Hubscher, J.-M. Egly, and R. D. Wood. 1995. Mammalian DNA nucleotide excision repair reconstituted with purified components. Cell 80:859-868. - PubMed
    1. Araki, M., C. Masutani, M. Takemura, A. Uchida, K. Sugasawa, J. Kondoh, Y. Ohkuma, and F. Hanaoka. 2001. Centrosome protein centrin 2/caltractin 1 is part of the xeroderma pigmentosum group C complex that initiates global genome nucleotide excision repair. J. Biol. Chem. 276:18665-18672. - PubMed
    1. Araujo, S. J., E. A. Nigg, and R. D. Wood. 2001. Strong functional interactions of TFIIH with XPC and XPG in human DNA nucleotide excision repair, without a preassembled repairosome. Mol. Cell. Biol. 21:2281-2291. - PMC - PubMed
    1. Araujo, S. J., F. Tirode, F. Coin, H. Pospiech, J. E. Syvaoja, M. Stucki, U. Hubscher, J. M. Egly, and R. D. Wood. 2000. Nucleotide excision repair of DNA with recombinant human proteins: definition of the minimal set of factors, active forms of TFIIH, and modulation by CAK. Genes Dev. 14:349-359. - PMC - PubMed
    1. Araujo, S. J., and R. D. Wood. 1999. Protein complexes in nucleotide excision repair. Mutat. Res. 435:23-33. - PubMed

Publication types

MeSH terms

LinkOut - more resources