. 2003 Aug;23(16):5908-18.
doi: 10.1128/MCB.23.16.5908-5918.2003.

Polysialic acid directs tumor cell growth by controlling heterophilic neural cell adhesion molecule interactions

Affiliations

Polysialic acid directs tumor cell growth by controlling heterophilic neural cell adhesion molecule interactions

Ralph Seidenfaden et al. Mol Cell Biol. 2003 Aug.

Abstract

Polysialic acid (PSA), a carbohydrate polymer attached to the neural cell adhesion molecule (NCAM), promotes neural plasticity and tumor malignancy, but its mode of action is controversial. Here we establish that PSA controls tumor cell growth and differentiation by interfering with NCAM signaling at cell-cell contacts. Interactions between cells with different PSA and NCAM expression profiles were initiated by enzymatic removal of PSA and by ectopic expression of NCAM or PSA-NCAM. Removal of PSA from the cell surface led to reduced proliferation and activated extracellular signal-regulated kinase (ERK), inducing enhanced survival and neuronal differentiation of neuroblastoma cells. Blocking with an NCAM-specific peptide prevented these effects. Combinatorial transinteraction studies with cells and membranes with different PSA and NCAM phenotypes revealed that heterophilic NCAM binding mimics the cellular responses to PSA removal. In conclusion, our data demonstrate that PSA masks heterophilic NCAM signals, having a direct impact on tumor cell growth. This provides a mechanism for how PSA may promote the genesis and progression of highly aggressive PSA-NCAM-positive tumors.


Figures
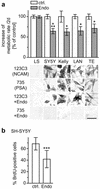
FIG. 1.
FIG. 1.
PSA removal induces growth inhibition in PSA-NCAM-positive tumor cells. (a) LS, SH-SY5Y, Kelly, and LAN-5 neuroblastoma and TE671 rhabdomyosarcoma cells were grown for 2 days in control medium (ctrl., white bars) or in the presence of 6 ng/ml (80 pM) endo-NE (Endo, grey bars). Growth rates were determined by metabolic assays performed at day 0 and day 2, and for each cell line, the rate of the untreated controls was set to 100%. Values represent means (± standard error of the mean) of a minimum of eight assays for each treatment. *, P < 0.05; ***, P < 0.001; t test. Micrographs show immunostaining of the cell lines with the NCAM- and PSA-specific antibodies 123C3 and 735 performed with untreated controls and after 2 days of endo-NE treatment (+Endo). Scale bar, 50 μm. (b) Incorporation of BrdU by SH-SY5Y cells grown for 2 days in control medium (ctrl.) or in the presence of endo-NE (Endo). BrdU was added 16 h prior to immunofluorescence analysis; 400 to 600 cells were evaluated, and the percentage of BrdU-positive cells is shown. Error bars indicate the 95% confidence intervals. ***, P < 0.001, χ2 test.
FIG. 2.
FIG. 2.
Growth inhibition after removal of PSA is mediated by NCAM interactions. (a) SH-SY5Y cells were treated for 2-day with 50 ng/ml BDNF, nerve growth factor or fibroblast growth factor-2 in the absence (ctrl., white bars) or presence of 6 ng of endo-NE per ml (Endo, grey bars). Metabolic rates were determined as in Fig. 1 and expressed as percent increase over the level of untreated controls. (b) Metabolic rates of SH-SY5Y (white bars) or TE671 cells (grey bars) treated for 2-day with C3d (1 μM), endo-NE (6 ng/ml), or both, as indicated. (c) Differentially transfected and endo-NE-treated LS cells (see text for details) were characterized by immunocytochemistry with PSA- or NCAM-specific antibodies as indicated (upper panels, scale bar, 50 μm). SH-SY5Y or parental LS cells were incubated with crude membrane fractions, prepared from all phenotypes. Shown are representative phase contrast images of SH-SY5Y cells without or with membrane fractions (MF, lower panels) illustrating the variable size and the density of the membrane particles (white arrowheads; scale bar, 10 μm). (d) Metabolic rates of SH-SY5Y (white bars) or parental LS cells (gray bars), exposed for 2-day to membrane fractions obtained from PSA- and NCAM-negative (mock), NCAM-positive (AM1, AM1PST+Endo) or PSA-NCAM-positive membrane fractions (AM1PST). Values in panels a, b, and d represent means (± standard error of the mean) of a minimum of 12 assays for each treatment. *, P < 0.05; **, P < 0.01; ***, P < 0.001; t test against the untreated controls or between the indicated values.
FIG. 3.
FIG. 3.
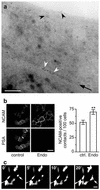
PSA-NCAM is localized at cell-cell contact sites. (a) Immunoelectron microscopic localization of cell-surface PSA by pre-embedding immunogold labeling and energy-filtering transmission electron microscopy of 500 nm thick sections. Antibodies were applied to fixed cells to achieve cell-surface staining and the technique used allows the analysis of large cell surface areas (26). Partial view of two adjacent cells with tight cell-cell contact (black arrow). Clustered labeling occurred scattered over the cell surface (black arrowheads) and was enriched at the contact site (white arrowheads). Scale bar, 0.5 μm. (b) Double immunofluorescence staining of PSA and NCAM was performed with untreated SH-SY5Y cells (control) and after endo-NE treatment for 2 days (Endo) as indicated. Scale bar, 25 μm. Numbers of NCAM-positive cell-cell contact sites were counted. Values represent means (± standard error of the mean) of six evaluated frames, with a total of 312 and 303 cells, respectively. **, P < 0.01; t test. (c) Time lapse fluorescence images of EGFP-transfected SH-SY5Y cells illustrate the high motility of some of the cells. Rapid changes of cell shape and cell-cell contacts can be observed. Notably, one cell that has no contact to other cells at 0 min is forming a broad cell-cell contact zone within 20 min (white arrows). Scale bar, 25 μm.
FIG. 4.
FIG. 4.
Removal of PSA leads to ERK activation. SH-SY5Y cells were supplied with fresh cell culture medium containing 60 ng of endo-NE per ml (Endo, Endo+) or solvent (ctrl., Endo−), incubated for the times indicated and analyzed by immunoblots with (a) NCAM-specific MAb 123C3 or (b) MAb E10, specific for dually phosphorylated ERK1/2 (pERK). Loading and transfer of proteins was controlled by Ponceau S staining of the blot membrane and only lanes with equal amounts of protein were used. (b) Antibodies were stripped off and membranes were reprobed with ERK1/2-specific antibodies to control for changes in ERK protein levels (ERK). Due to saturation of the ERK bands, a higher dilution of the ERK 1/2 specific antibody was used in all further experiments. Changes in the amount of ERK protein were never detected. (c) Densitometric evaluation of pERK relative to the mean value of control cultures analyzed 48 h after medium change. Since ERK1 and ERK2 were not always separated unambiguously, the pERK bands were evaluated together. Values are means (± standard error of the mean) of three to six independent experiments. *, P < 0.05; **, P < 0.01; t test against the time-matched controls.
FIG. 5.
FIG. 5.
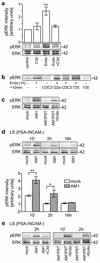
ERK activation by heterophilic NCAM interactions. ERK phosphorylation (pERK) and total ERK protein (ERK) were analyzed as in Fig. 4, with the ERK1/2-specific antibody at a dilution of 1:2,000. In all experiments shown, dual phosphorylation of ERK was analyzed with MAb E10, except for panel a, where a rabbit PAb with a higher affinity towards pERK1 (p44) was used. (a to c) SH-SY5Y cells were treated as indicated: (a) with C3d (1 μM), endo-NE (60 ng/ml), or both for 2 h; (b) without or with endo-NE (60 ng/ml) for 1 h, followed by a 10-min exposure to control medium or medium containing NCAM-specific MAb 123C3, PSA-specific MAb 735 or ganglioside GD2-specific MAb 14G2a (5 μg/ml each); (c) with membrane fractions prepared from LSmock (PSA negative, NCAM negative), LSAM1 (PSA negative, NCAM positive), LSAM1PST (PSA positive, NCAM positive), or LSAM1PST+Endo (PSA negative, NCAM positive) for 2 h. (d and e) As indicated, parental LS cells (PSA negative, NCAM negative) were treated with the different membrane fractions specified in panel c in the presence or absence of C3d (1 μM). The experiments shown in panels b and and c were repeated at least once with identical outcome and equal results were obtained with TE671 cells (see text). Densitometric evaluation of the pERK signal in panels a and d represents means (± standard error of the mean) of three to five independent experiments each. Values in panel a are normalized to the untreated controls, and ** indicates a significant difference to all other groups shown (P < 0.01, repeated measure ANOVA). Due to the moderate activation of MAPK by the supply with fresh serum (see text related to Fig. 4), data in panel d were expressed relative to control cultures analyzed 48 h after medium change. *, P < 0.05; **, P < 0.01; paired t tests against the time-matched controls.
FIG. 6.
FIG. 6.
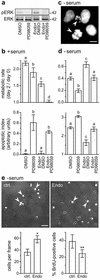
PSA removal modulates MAPK-dependent survival and apoptosis. Serum-supplemented or serum-deprived SH-SY5Y cells were treated with the MEK inhibitor PD98059 (50 μM in dimethyl sulfoxide) or solvent (1 μl of dimethyl sulfoxide/ml) in the presence or absence of endo-NE (6 ng/ml). (a) PD98059 inhibits ERK phosphorylation in SH-SY5Y cells. Cells were treated for 2 h in serum-supplemented medium as indicated and ERK phosphorylation was analyzed (see Fig. 4 and 5). (b to d) SH-SY5Y cells were grown for 2-day in (b) serum-supplemented or (c and d) serum-deprived medium in the presence of dimethyl sulfoxide, PD98059 or endo-NE as indicated. Cell growth or survival was determined by metabolic assays (b and d, upper graphs). To detect apoptosis, the morphology of nuclei was analyzed by DAPI immunofluorescence and the occurrence of apoptotic nuclei after serum withdrawal is shown (c, white arrowheads, scale bar 10 μm). ELISA detection of intracellular mono- and oligonucleosomes was used to calculate an arbitrary apoptotic index (b and d, lower graphs). Values in panels b and d represent means (± standard error of the mean) of a minimum of eight independent metabolic assays or three to five determinations of apoptotic indices. Different letters denote significant differences between groups (P < 0.05, one-way ANOVA). (e) Effect of endo-NE treatment on cell number and BrdU incorporation of serum-deprived SH-SY5Y cells. Phase contrast images of control (ctrl.) or endo-NE-treated cells (Endo) were combined with immunofluorescent labeling for BrdU (white arrowheads, scale bar, 100 μm). Total cell numbers and BrdU-labeled nuclei were counted from six frames each. Means of cell counts are shown ± standard error of the mean, *, P < 0.05, t test. The percentage of BrdU-positive cells is given ± 95% confidence intervals, **, P < 0.01, χ2 test.
FIG. 7.
FIG. 7.
Effect of PSA removal, trans-interacting NCAM and MAPK on neuronal differentiation. (a to d) EGFP fluorescence of SH-SY5YEGFPcells grown for 48 h (a) in the absence or (b) in the presence of endo-NE (6 ng/ml) or together with crude membrane fractions of (c) NCAM-negative LSmock or (d) NCAM-positive LSAM1. Scale bar, 100 μm. (Insets in panels a and b) With or without endo-NE treatment, neurite-bearing SH-SY5YEGFP cells were positive for neurofilament immunofluorescence. Scale bar, 50 μm. (e to h) Length of neurites (e and g) and percentage of neurite-bearing SH-SY5YEGFP cells (f and h) relative to untreated controls (see text for details). (e and f) Neurite formation of SH-SY5YEGFP cells grown in the presence of solvent (1 μl of dimethyl sulfoxide/ml), the MEK-inhibitor PD 98059 (50 μM in dimethyl sulfoxide), or endo-NE (6 ng/ml) as indicated. (g and h) Neurite formation of SH-SY5YEGFP cells cocultured with crude membrane fractions prepared from NCAM-negative LSmock (mock), NCAM-positive LSAM1 (AM1), PSA-NCAM-positive LSAM1PST (AM1PST), or LSAM1PST treated with endo-NE to remove PSA (AM1PST+Endo). In each of the three experimental series, three to six independent experiments were evaluated and between 300 and 600 cells per experiment were analyzed for each experimental group. Due to some variability between the different experiments, the values of each experiment were standardized relative to the untreated control (100%). Means (± standard error of the mean) are shown, and different letters denote significant differences between groups (one-way ANOVA, P < 0.05 in panels e, g, and h; P < 0.01 in panel f).

Similar articles

Cited by

References

    1. Amoureux, M. C., B. A. Cunningham, G. M. Edelman, and K. L. Crossin. 2000. N-CAM binding inhibits the proliferation of hippocampal progenitor cells and promotes their differentiation to a neuronal phenotype. J. Neurosci. 20:3631-3640. - PMC - PubMed
    1. Aubert, I., J. L. Ridet, and F. H. Gage. 1995. Regeneration in the adult mammalian CNS: guided by development. Curr. Opin. Neurobiol. 5:625-635. - PubMed
    1. Cavallaro, U., J. Niedermeyer, M. Fuxa, and G. Christofori. 2001. N-CAM modulates tumour-cell adhesion to matrix by inducing fibroblast growth factor-receptor signalling. Nat. Cell Biol. 3:650-657. - PubMed
    1. Cole, G. J., and R. Akeson. 1989. Identification of a heparin binding domain of the neural cell adhesion molecule N-CAM with synthetic peptides. Neuron 2:1157-1165. - PubMed
    1. Crossin, K. L., and L. A. Krushel. 2000. Cellular signaling by neural cell adhesion molecules of the immunoglobulin superfamily. Dev. Dyn. 218:260-279. - PubMed

Publication types

MeSH terms