. 2003 Oct 1;552(Pt 1):149-62.
doi: 10.1113/jphysiol.2003.050369. Epub 2003 Aug 1.

Cold exposure induces tissue-specific modulation of the insulin-signalling pathway in Rattus norvegicus

Affiliations

Cold exposure induces tissue-specific modulation of the insulin-signalling pathway in Rattus norvegicus

Alessandra L Gasparetti et al. J Physiol. .

Abstract

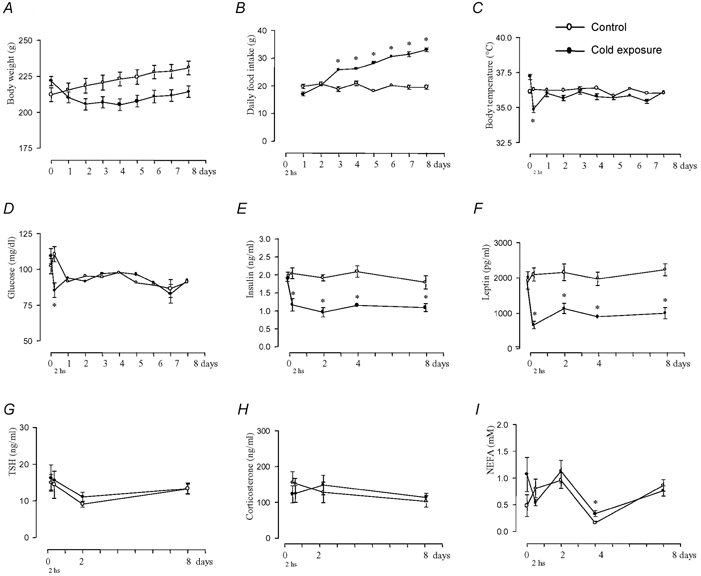
Cold exposure provides a reproducible model of improved glucose turnover accompanied by reduced steady state and glucose-induced insulin levels. In the present report we performed immunoprecipitation and immunoblot studies to evaluate the initial and intermediate steps of the insulin-signalling pathway in white and brown adipose tissues, liver and skeletal muscle of rats exposed to cold. Basal and glucose-induced insulin secretion were significantly impaired, while glucose clearance rates during a glucose tolerance test and the constant for glucose decay during a 15 min insulin tolerance test were increased, indicating a significantly improved glucose turnover and insulin sensitivity in rats exposed to cold. Evaluation of protein levels and insulin-induced tyrosine (insulin receptor, insulin receptor substrates (IRS)-1 and -2, ERK (extracellular signal-related kinase)) or serine (Akt; protein kinase B) phosphorylation of proteins of the insulin signalling cascade revealed a tissue-specific pattern of regulation of the molecular events triggered by insulin such that in white adipose tissue and skeletal muscle an impaired molecular response to insulin was detected, while in brown adipose tissue an enhanced response to insulin was evident. In muscle and white and brown adipose tissues, increased 2-deoxy-D-glucose (2-DG) uptake was detected. Thus, during cold exposure there is a tissue-specific regulation of the insulin-signalling pathway, which seems to favour heat-producing brown adipose tissue. Nevertheless, muscle and white adipose tissue are able to take up large amounts of glucose, even in the face of an apparent molecular resistance to insulin.


Figures

Figure 1
Figure 1. Metabolic characterization of rats exposed to cold
Body weight (A), daily food intake (B), body temperature (C), plasma glucose (D), serum insulin (E), serum leptin (F), serum TSH (G), serum corticosterone (H) and serum NEFA (I) concentrations were determined in rats exposed to 4 °C (•) or maintained at room temperature (○) according to the methods described in the text. Results are expressed as means ± s.e.m.; n = 12 for A−D and I; n = 8 for E−H. * P < 0.05 vs. control.
Figure 2
Figure 2. Effect of 8 days cold exposure on glucose metabolism
Glucose (A) and insulin (B) concentrations during I.P. GTT, and glucose disappearance rate (A, inset) in control and cold-exposed rats. The constant rate for plasma glucose disappearance (Kitt) was calculated as described in Methods. HOMA values (C) for control and cold-exposed rats were calculated as previously described (Matthews et al. 1985). Results are representative of the mean ± s.e.m.; n = 8 for A−C; n = 12 for A, inset. * P < 0.05 vs. control.
Figure 3
Figure 3. Static insulin secretion studies
Insulin secretion (A) was calculated from the accumulation of insulin in supernatants of 5 islets/well isolated from cold-exposed or control rats and maintained in medium containing either 2.8 or 16.7 mM glucose. The percentage increment (B) of glucose-induced insulin secretion was obtained from the difference in secretion between islets exposed to 2.8 and 16.7 mM glucose in each experimental group. Values are representative of means ± s.e.m.; n = 6 wells/group. * P < 0.05 vs. control.
Figure 4
Figure 4. Tissue-specific glucose uptake
2-[3 H]-Deoxyglucose uptake in brown adipose tissue (BAT) (A), skeletal muscle (B), white adipose tissue (WAT) (C) and liver (D) of control and cold-exposed insulin animals was determined as described in the text. Results are expressed as means ± s.e.m.; n = 5. * P < 0.05 vs. control + insulin.
Figure 5
Figure 5. Tissue glycogen and fat content
Hepatic (A) and muscular (B) glycogen concentrations, and percentage of body fat (C) were determined in cold-exposed and control rats. Results are expressed as means ± s.e.m., n = 6. * P < 0.05 vs. control.
Figure 6
Figure 6. Insulin signal transduction in brown adipose tissue
The protein levels of IR (A), IRS1 (C), and IRS2 (E) were determined in brown adipose tissue (BAT) of control and cold-exposed rats. Samples (200 μg) of total protein extracts from each tissue were separated by SDS-PAGE, transferred to nitrocellulose membranes and blotted (IB) with anti-IR (A), anti-IRS1 (C) or anti-IRS2 (E) antibodies. Tyrosine phosphorylation of IR (B), IRS1 (D) and IRS-2 (F) was evaluated in brown adipose tissue protein extracts by immunoprecipitation (IP) with anti-IR (B), anti-IRS1 (D) and anti-IRS-2 (F) antibodies, and immunoblotting with anti-phosphotyrosine (PY) antibodies. Serine473 phosphorylation of Akt (G) and tyrosine phosphorylation of ERK (H) were determined by blotting of total protein extracts, separated by SDS-PAGE and transferred to nitrocellulose membranes. Data are presented as means ± s.e.m., n = 6. * P < 0.05 vs. control.
Figure 7
Figure 7. Insulin signal transduction in white adipose tissue
The protein levels of IR (A), IRS1 (C), IRS2 (E) were determined in white adipose tissue (WAT) of control and cold-exposed rats. Samples (200 μg) of total protein extracts from each tissue were separated by SDS-PAGE, transferred to nitrocellulose membranes and blotted (IB) with anti-IR (A), anti-IRS1 (C) or anti-IRS2 (E) antibodies. Tyrosine phosphorylation of IR (B), IRS1 (D) and IRS-2 (F) was evaluated in white adipose tissue protein extracts by immunoprecipitation (IP) with anti-IR (B), anti-IRS1 (D) and anti-IRS-2 (F) antibodies, and immunoblotting with anti-phosphotyrosine (PY) antibodies. Serine473 phosphorylation of Akt (G) and tyrosine phosphorylation of ERK (H) were determined by blotting of total protein extracts, separated by SDS-PAGE and transferred to nitrocellulose membranes. Data are presented as means ± s.e.m., n = 6. * P < 0.05 vs. control.
Figure 8
Figure 8. Insulin signal transduction in skeletal muscle
The protein levels of IR (A), IRS1 (C), IRS2 (E) were determined in skeletal muscle of control and cold-exposed rats. Samples (200 μg) of total protein extracts from each tissue were separated by SDS-PAGE, transferred to nitrocellulose membranes and blotted (IB) with anti-IR (A), anti-IRS1 (C) or anti-IRS2 (E) antibodies. Tyrosine phosphorylation of IR (B), IRS1 (D) and IRS-2 (F) was evaluated in skeletal muscle protein extracts by immunoprecipitation (IP) with anti-IR (B), anti-IRS1 (D) and anti-IRS-2 (F) antibodies, and immunoblotting with anti-phosphotyrosine (PY) antibodies. Serine473 phosphorylation of Akt (G) and tyrosine phosphorylation of ERK (H) were determined by blotting of total protein extracts, separated by SDS-PAGE and transferred to nitrocellulose membranes. Data are presented as means ± s.e.m., n = 6. * P < 0.05 vs. control.
Figure 9
Figure 9. Insulin signal transduction in liver
The protein levels of IR (A), IRS1 (C), IRS2 (E) was determined in liver of control and cold-exposed rats. Samples (200 μg) of total protein extracts from each tissue were separated by SDS-PAGE, transferred to nitrocellulose membranes and blotted (IB) with anti-IR (A), anti-IRS1 (C) or anti-IRS2 (E) antibodies. Tyrosine phosphorylation of IR (B), IRS1 (D) and IRS-2 (F) was evaluated in liver protein extracts by immunoprecipitation (IP) with anti-IR (B), anti-IRS1 (D) and anti-IRS-2 (F) antibodies, and immunoblotting with anti-phosphotyrosine (PY) antibodies. Serine473 phosphorylation of Akt (G) and tyrosine phosphorylation of ERK (H) were determined by blotting of total protein extracts, separated by SDS-PAGE and transferred to nitrocellulose membranes. Data are presented as means ± s.e.m., n = 6. * P < 0.05 vs. control.
Figure 10
Figure 10. GLUT-4 expression and subcellular distribution
The protein levels of GLUT-4 were determined by SDS-PAGE and immunoblot of whole tissue extracts (A-C left-hand panels) and in subcellular fractions (middle and right-hand panels) of cytosol and membrane of BAT (A), WAT (B) and skeletal muscle (C). Data are presented as means ± s.e.m., n = 6. * P < 0.05 vs. control. # P < 0.05 vs. membrane without (−) insulin.

References

    1. Araujo EP, Amaral ME, Souza CT, Bordin S, Ferreira F, Saad MJ, Boschero AC, Magalhaes EC, Velloso LA. Blockade of IRS1 in isolated rat pancreatic islets improves glucose-induced insulin secretion. FEBS Lett. 2002;531:437–442. - PubMed
    1. Bonora E, Zavaroni I, Alpi O, Pezzarossa A, Dall'Aglio E, Coscelli C, Butturini U. Influence of the menstrual cycle on glucose tolerance and insulin secretion. Am J Obstet Gynecol. 1987;157:140–141. - PubMed
    1. Cassis L, Laughter A, Fettinger M, Akers S, Speth R, Burke G, King V, Dwoskin L. Cold exposure regulates the renin-angiotensin system. J Pharmacol Exp Ther. 1998;286:718–726. - PubMed
    1. Cunningham JJ, Gulino MA, Meara PA, Bode HH. Enhanced hepatic insulin sensitivity and peripheral glucose uptake in cold acclimating rats. Endocrinology. 1985;117:1585–1589. - PubMed
    1. Dulloo AG, Young JB, Landsberg L. Sympathetic nervous system responses to cold exposure and diet in rat skeletal muscle. Am J Physiol. 1988;255:E180–188. - PubMed

Publication types

MeSH terms

LinkOut - more resources