. 2003 Aug;112(3):332-44.
doi: 10.1172/JCI16815.

Adenosine mediates IL-13-induced inflammation and remodeling in the lung and interacts in an IL-13-adenosine amplification pathway

Affiliations

Adenosine mediates IL-13-induced inflammation and remodeling in the lung and interacts in an IL-13-adenosine amplification pathway

Michael R Blackburn et al. J Clin Invest. 2003 Aug.

Abstract

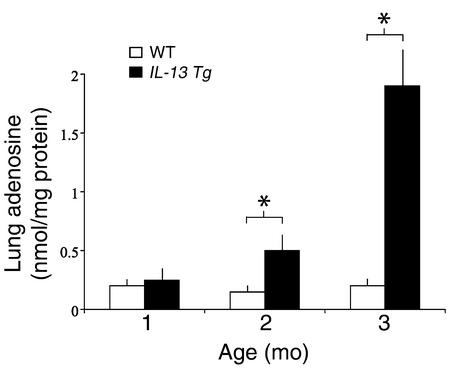
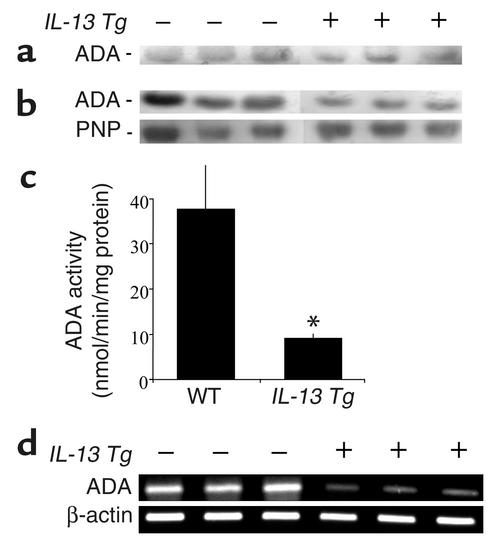
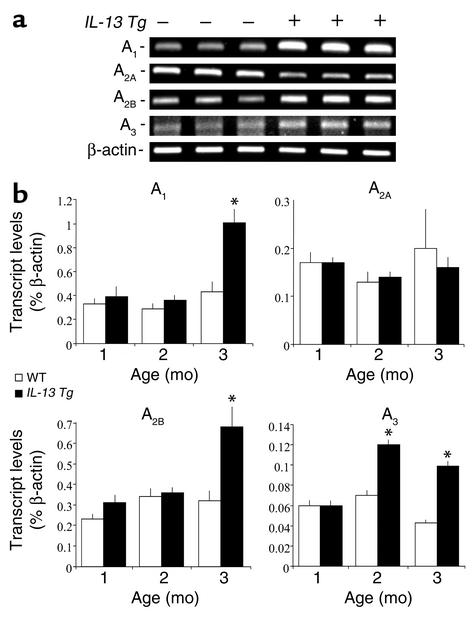
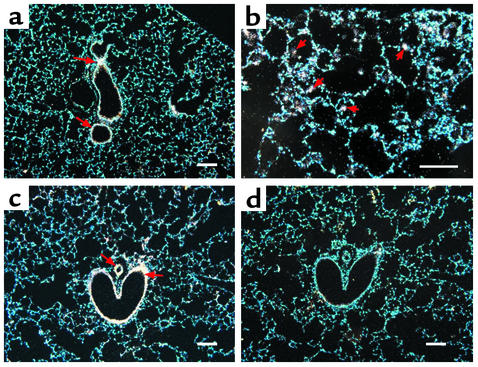
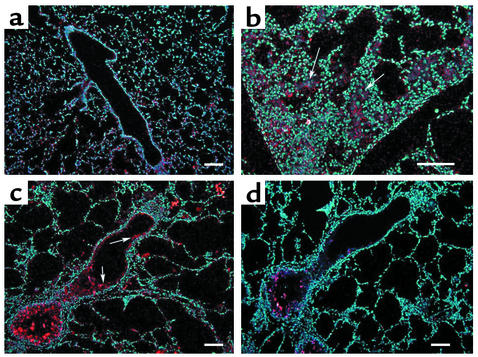
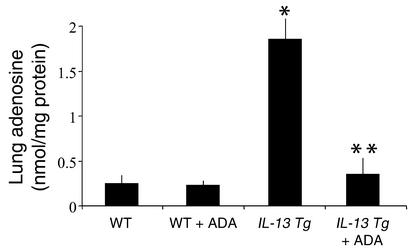
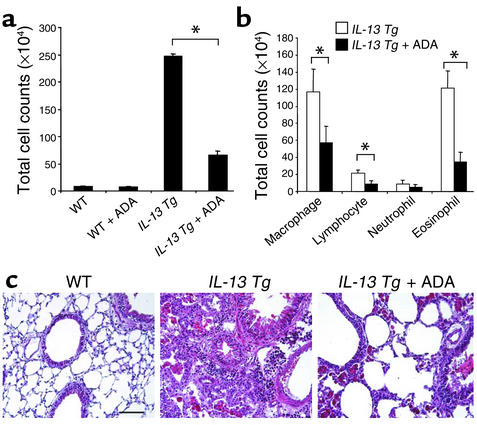
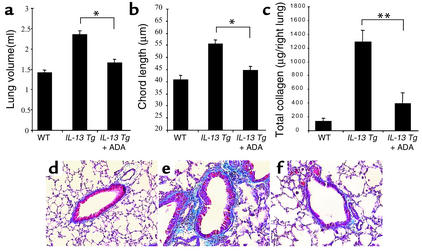
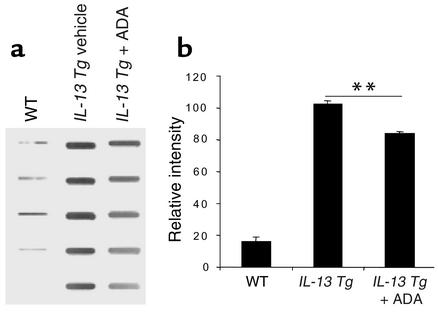
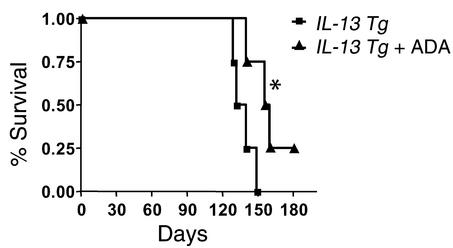
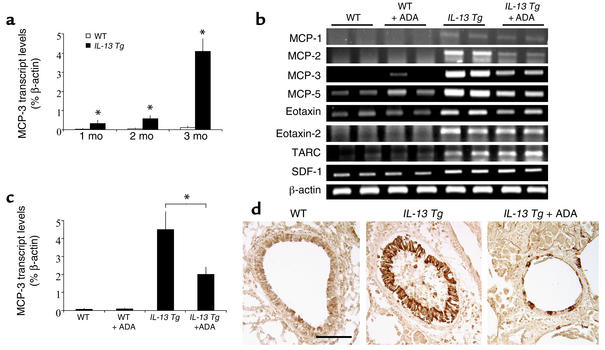
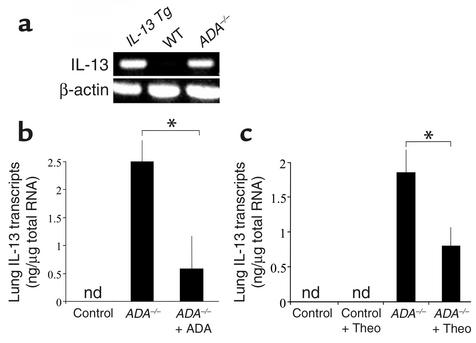
IL-13 is an important mediator of inflammation and remodeling. We hypothesized that adenosine accumulation, alterations in adenosine receptors, and adenosine-IL-13 autoinduction are critical events in IL-13-induced pathologies. To test this, we characterized the effects of IL-13 overexpression on the levels of adenosine, adenosine deaminase (ADA) activity, and adenosine receptors in the murine lung. We also determined whether adenosine induced IL-13 in lungs from ADA-null mice. IL-13 induced an inflammatory and remodeling response that caused respiratory failure and death. During this response, IL-13 caused a progressive increase in adenosine accumulation, inhibited ADA activity and mRNA accumulation, and augmented the expression of the A1, A2B, and A3 but not the A2A adenosine receptors. ADA enzyme therapy diminished the IL-13-induced increase in adenosine, inhibited IL-13-induced inflammation, chemokine elaboration, fibrosis, and alveolar destruction, and prolonged the survival of IL-13-transgenic animals. In addition, IL-13 was strongly induced by adenosine in ADA-null mice. These findings demonstrate that adenosine and adenosine signaling contribute to and influence the severity of IL-13-induced tissue responses. They also demonstrate that IL-13 and adenosine stimulate one another in an amplification pathway that may contribute to the nature, severity, progression, and/or chronicity of IL-13 and/or Th2-mediated disorders.


Figures

Figure 1
Figure 1
Lung adenosine levels are increased in IL-13 Tg mice. Adenosine levels were quantified in lungs from Tg CC10-IL-13 mice at 1, 2, and 3 months of age. Non-Tg (WT) littermates were used as controls. Mean values are given as nanomoles of adenosine per milligram of protein ± SE. n = 4 for 1- and 2-month time points; n = 6 for the 3-month time point. Statistical significance was determined using Student t test analysis; *P = 0.005.
Figure 2
Figure 2
ADA expression is decreased in lungs from IL-13 Tg mice. (a) Serum was collected from 3-month-old wild-type, transgene-negative (–), or IL-13 Tg–positive (+) mice and subjected to zymogram analysis to examine levels of circulating ADA enzymatic activity. (b) ADA enzymatic activity was assessed in crude protein extracts from lungs from 3-month-old transgene-negative (–) and transgene-positive (+) mice using a zymographic assay system. Purine nucleoside phosphorylase (PNP) was used as a positive control for a purine metabolic enzyme that did not change. (c) ADA enzymatic activity was determined in lung extracts using a spectrophotometric assay. ADA-specific activities are shown and represent nanomoles of adenosine converted to inosine per minute per microgram of protein ± SE. n = 4 for each group. *P = 0.05 using Student t test. (d) Total cellular RNA was isolated from the lungs of 3-month-old transgene-negative (–) or transgene-positive (+) mice and subjected to RT-PCR using primers specific for ADA.
Figure 3
Figure 3
Alterations in adenosine receptor transcript levels in the lungs of IL-13 Tg mice. (a) Total cellular RNA was isolated from the lungs of 3-month-old wild-type (–) or IL-13 Tg mice (+) and subjected to RT-PCR using primer pairs specific for the four adenosine receptors. (b) Transcript levels for the A1, A2A, A2B, and A3 adenosine receptors were quantified using real-time RT-PCR in RNA isolated from whole lungs from wild-type and Tg mice at 1, 2, and 3 months of age. Values were normalized to β-actin transcript levels and are presented as the mean percentage of β-actin transcripts ± SE. Statistical significance was determined using Student t test analysis comparing wild-type to control values at each time point. n = 4 for each condition. *P < 0.005.
Figure 4
Figure 4
Expression of the A1 adenosine receptor in the lungs of IL-13 Tg mice. (a) Dark-field image of a 3-month-old wild-type lung hybridized with an antisense cRNA probe specific for the A1 adenosine receptor. (b) High magnification of a distal portion of a 3-month-old IL-13 Tg lung hybridized with antisense A1 probe. Arrowheads denote inflammatory cells. (c) Three-month IL-13 Tg lung hybridized with antisense A1 probe. Arrowheads denote airway epithelial cells. (d) Serial section of lung shown in c hybridized with a sense cRNA probe specific for the A1 adenosine receptor. Green pixels denote specific hybridization, while blue epifluorescence represents nuclei stained with Hoechst 33258. Scale bars: 100 μm.
Figure 5
Figure 5
Expression of the A2B adenosine receptor in the lungs of IL-13 Tg mice. (a) Dark-field image of a 3-month-old wild-type lung hybridized with an antisense cRNA probe specific for the A2B adenosine receptor. Arrows denote expression in bronchial epithelium. (b) High-magnification of a distal portion of a 3-month-old IL-13 Tg lung hybridized with antisense A2B probe denoting expression in alveolar macrophages (arrowheads). (c) Three-month IL-13 Tg lung hybridized with antisense A2B probe. Arrows denote expression in bronchial epithelium and blood vessels. (d) Serial section of lung shown in c hybridized with a sense cRNA probe specific for the A2B adenosine receptor. White pixels denote specific hybridization, while blue epifluorescence represents nuclei stained with Hoechst 33258. Scale bars: 100 μm.
Figure 6
Figure 6
Expression of the A3 adenosine receptor in the lungs of IL-13 Tg mice. (a) Dark-field image of a 3-month-old wild-type lung hybridized with an antisense cRNA probe specific for the A3 adenosine receptor. (b) High magnification of a distal portion of a 3-month-old IL-13 Tg lung hybridized with antisense A3 probe denoting expression in regions of inflammation and remodeling (arrows). (c) Three-month-old IL-13 Tg lung hybridized with antisense A3 probe. Arrows denote expression in hypertrophied epithelium of the bronchial airways. (d) Serial section of lung shown in c hybridized with a sense cRNA probe specific for the A3 adenosine receptor. Red pixels denote specific hybridization, while blue epifluorescence represents nuclei stained with Hoechst 33528. Scale bars: 100 μm.
Figure 7
Figure 7
ADA enzyme therapy prevents adenosine accumulation in the lungs of IL-13 Tg mice. Two-month-old wild-type or IL-13 Tg mice were treated intraperitoneally with ADA enzyme therapy (+ ADA) for 1 month as described in Methods. At 3 months of age, adenosine levels were quantified in the lungs. Mean values are given as nanomoles of adenosine per milligram of protein ± SE. n = 4 for each group. *P < 0.05 vs. WT using Student t test; **P < 0.01 vs. IL-13 Tg.
Figure 8
Figure 8
Effects of ADA enzyme therapy on the inflammation in lungs from IL-13 Tg mice. Two-month-old wild-type or IL-13 Tg mice were treated intraperitoneally with ADA enzyme therapy (+ ADA) for 1 month as described in Methods. At 3 months of age, the total numbers of cells (a) and the numbers of macrophages, lymphocytes, eosinophils, and neutrophils (b) recovered from the BAL fluid were determined. Values are given as mean total cell counts × 104 ± SE. Statistical significance was determined using Student t test analysis. n = 6 for each condition. *P < 0.001. (c) Representative H&E-stained sections through 3-month-old wild-type and IL-13 Tg lungs and 3-month-old IL-13 Tg lungs treated for 1 month with PEG-ADA. Similar results were seen in four different mice treated with PEG-ADA.
Figure 9
Figure 9
Effects of ADA enzyme therapy on the remodeling and fibrosis lungs from IL-13 Tg mice. Two-month-old wild-type or IL-13 Tg mice were treated with intranasal ADA enzyme therapy (+ ADA) for 10 days or with vehicle control. At the end of this interval, lung volume (a) and alveolar chord length (b) were evaluated as described in Methods. Values are given as mean ± SE. Statistical significance was determined using Student t test analysis. n = 6 for each condition. *P < 0.001. (c) Two-month-old wild-type or IL-13 Tg mice were treated with intranasal ADA enzyme therapy (+ ADA) for 30 days or with vehicle control. At the end of this interval, lung collagen content was assessed as described in Methods. Values are given as mean ± SE. Statistical significance was determined using Student t test analysis. n = 6 for each condition. *P = 0.005. (df) Two-month-old wild-type or IL-13 Tg mice were treated with intranasal ADA enzyme therapy for 30 days or with vehicle control. At the end of this interval, trichrome histologic evaluations of lung collagen were undertaken. The figure compares wild-type mice (d), Tg mice treated with vehicle (e), and Tg mice treated with PEG-ADA (f).
Figure 10
Figure 10
Effects of ADA enzyme therapy on BAL mucin secretion in lungs from IL-13 Tg mice Two-month-old wild-type or IL-13 Tg mice were treated with intranasal ADA enzyme therapy (+ ADA) or vehicle control for 10 days. At the end of this interval immunoblot analysis of BAL fluid was undertaken to quantify MUC-5AC as described in Methods. The immunoblot is on the left. Each row is representative of a different animal. The densitometric summary is on the right. **P < 0.01 using Student t test.
Figure 11
Figure 11
ADA enzyme therapy promotes the survival of IL-13 Tg mice. Two-month-old wild-type or IL-13 Tg mice were treated with ADA enzyme therapy (+ ADA), and survival was monitored as described in Methods. This is a representative experiment of n = 4. Statistical significance was determined using the Wilcoxon rank sum test. n = 4 for each group. *P < 0.03.
Figure 12
Figure 12
ADA enzyme therapy regulates chemokine expression in the lungs of IL-13 Tg mice. (a) MCP-3 transcript levels were quantified using real-time RT-PCR in RNA isolated from whole lungs from wild-type and Tg (IL-13 Tg) lungs at 1, 2, and 3 months of age. Values were normalized to β-actin transcript levels and are presented as the mean percentage of β-actin transcripts ± SE. Statistical significance was determined using Student t test analysis comparing wild-type to control values at each time point. n = 4 for each condition. *P = 0.005. (b) RT-PCR analysis of the levels of mRNA encoding IL-13–relevant chemokines in whole-lung RNA from 3-month-old wild-type and IL-13 Tg mice treated with PEG-ADA (+ ADA) or vehicle for 1 month. (c) Quantitative real-time RT-PCR analysis of MCP-3 transcript levels in whole-lung RNA from 3-month-old wild-type and IL-13 Tg mice treated with PEG-ADA (+ ADA) or vehicle for 1 month. Values are presented as the mean percentage of β-actin transcripts ± SE. Statistical significance was determined using Student t test analysis. *P < 0.005. n = 4 for each condition. (d) Immunohistochemistry was used to localize MCP-3 in lung sections from 3-month-old wild-type, IL-13 Tg, or IL-13 Tg mice treated with PEG-ADA for 1 month. Scale bar = 100 μm and applies to all three photographs in d.
Figure 13
Figure 13
Adenosine-dependent elevations in IL-13 mRNA in lungs from ADA-deficient mice. (a) Whole-lung RNA was extracted from 3-month-old IL-13 Tg mice and 3-week old wild-type and ADA-deficient mice. RT-PCR was used to evaluate the levels of mRNA encoding IL-13 in these samples. (b) Three-week-old ADA-deficient (ADA–/–) mice were treated with a single injection of PEG-ADA, and lung IL-13 mRNA levels were evaluated 72 hours later. IL-13 transcript values are presented as mean nanograms of IL-13 ± SE. n = 5 for each treatment. *P = 0.005. (c) Control and ADA-deficient mice were maintained on ADA enzyme therapy for 3 weeks, and then Alzet pumps containing either theophylline (+ Theo) or saline were implanted. IL-13 mRNA levels were quantitated 12 days later. n = 6 for each treatment. *P = 0.05. nd, not detected.

Comment in

References

    1. Bradding, P., Redington, A.E., and Holgate, S.T. 1997. Airway wall remodelling in the pathogenesis of asthma: cytokine expression in the airways. In Airway wall remodelling in asthma. A.G. Stewart, editor. CRC Press Inc. Boca Raton, Florida, USA. 29–63.
    1. Elias JA, Zhu Z, Chupp G, Homer RJ. Airway remodeling in asthma. J. Clin. Invest. 1999;104:1001–1006. - PMC - PubMed
    1. Wallace WA, Ramage EA, Lamb D, Howie SE. A type 2 (Th2-like) pattern of immune response predominates in the pulmonary interstitium of patients with cryptogenic fibrosing alveolitis (CFA) Clin. Exp. Immunol. 1995;101:436–441. - PMC - PubMed
    1. Belperio JA, et al. Interaction of IL-13 and C10 in the pathogenesis of bleomycin-induced pulmonary fibrosis. Am. J. Respir. Cell Mol. Biol. 2002;27:419–427. - PubMed
    1. Cosio MG, Guerassimov A. Chronic obstructive pulmonary disease. Am. J. Respir. Crit. Care Med. 1999;160(Suppl.):S21–S25. - PubMed

Publication types

MeSH terms