. 2003 Aug;112(3):423-31.
doi: 10.1172/JCI17725.

The endogenous cannabinoid system affects energy balance via central orexigenic drive and peripheral lipogenesis

Affiliations

The endogenous cannabinoid system affects energy balance via central orexigenic drive and peripheral lipogenesis

Daniela Cota et al. J Clin Invest. 2003 Aug.

Abstract

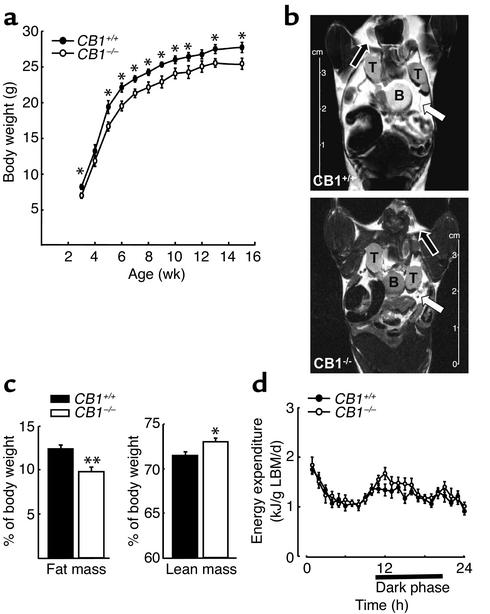
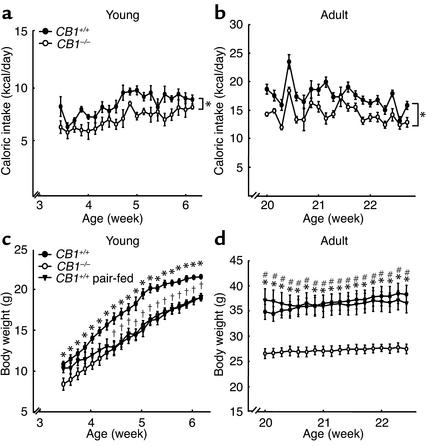
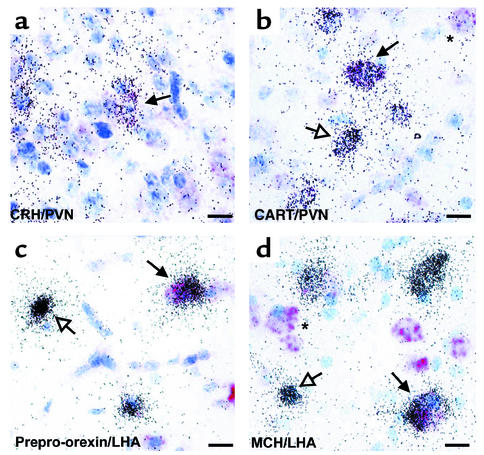
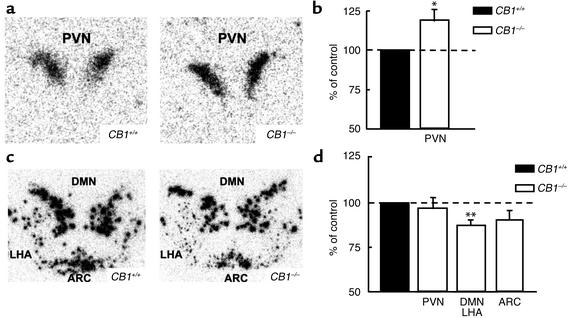
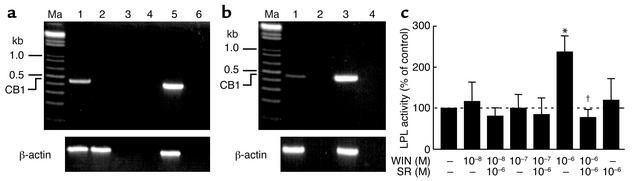
The cannabinoid receptor type 1 (CB1) and its endogenous ligands, the endocannabinoids, are involved in the regulation of food intake. Here we show that the lack of CB1 in mice with a disrupted CB1 gene causes hypophagia and leanness. As compared with WT (CB1+/+) littermates, mice lacking CB1 (CB1-/-) exhibited reduced spontaneous caloric intake and, as a consequence of reduced total fat mass, decreased body weight. In young CB1-/- mice, the lean phenotype is predominantly caused by decreased caloric intake, whereas in adult CB1-/- mice, metabolic factors appear to contribute to the lean phenotype. No significant differences between genotypes were detected regarding locomotor activity, body temperature, or energy expenditure. Hypothalamic CB1 mRNA was found to be coexpressed with neuropeptides known to modulate food intake, such as corticotropin-releasing hormone (CRH), cocaine-amphetamine-regulated transcript (CART), melanin-concentrating hormone (MCH), and preproorexin, indicating a possible role for endocannabinoid receptors within central networks governing appetite. CB1-/- mice showed significantly increased CRH mRNA levels in the paraventricular nucleus and reduced CART mRNA levels in the dorsomedial and lateral hypothalamic areas. CB1 was also detected in epidydimal mouse adipocytes, and CB1-specific activation enhanced lipogenesis in primary adipocyte cultures. Our results indicate that the cannabinoid system is an essential endogenous regulator of energy homeostasis via central orexigenic as well as peripheral lipogenic mechanisms and might therefore represent a promising target to treat diseases characterized by impaired energy balance.


Figures

Figure 1
Figure 1
Body weight, body composition and EE of CB1–/– mice. (a) Body weight curves in male mice starting at 3 weeks of age. Each data point represents mean ± SEM of 15 mice. *P < 0.05 vs. CB1+/+ littermates. (b) NMR imaging performed in 16-week-old mice. White arrow, visceral fat; black arrow, subcutaneous fat; T, testis; B, bladder. (c) Analysis of body composition by quantitative NMR. Fat mass and lean mass expressed as percentage of the body weight. The columns represent the mean ± SEM of 15 CB1+/+ and CB1–/– mice, respectively. *P < 0.05 and **P < 0.005 vs. CB1+/+ controls. (d) EE in male CB1+/+ and CB1–/– mice. Data are normalized to LBM. Each data point represents mean ± SEM of six mice.
Figure 2
Figure 2
Food intake and pair-feeding studies in CB1–/– mice. (a) Daily energy intake of young CB1+/+ and CB1–/– mice. Each data point represents mean ± SEM of six mice for each group. *P < 0.05, AUC of caloric intake of CB1–/– mice vs. CB1+/+ littermates. (b) Daily energy intake of adult CB1–/– and CB1+/+ mice. Each data point represents mean ± SEM of six mice for each group. *P < 0.05, AUC of caloric intake of CB1–/– mice vs. CB1+/+ littermates. (c) Body weight curves during pair-feeding in young mice. Each data point represents mean ± SEM of six mice for each group. *P < 0.05 CB1–/– mice vs. CB1+/+ controls; P < 0.05 pair-fed CB1+/+ mice vs. CB1+/+ controls. (d) Body weight curves during pair-feeding in adult mice. Each data point represents mean ± SEM of six mice for each group.*P < 0.005 CB1–/– mice vs. CB1+/+ controls; #P < 0.005 CB1–/– mice vs. pair-fed CB1+/+ mice. Body weight did not significantly differ between pair-fed CB1+/+ mice and CB1+/+ controls.
Figure 3
Figure 3
CB1 transcripts are co-localized with mRNAs of hypothalamic neuropeptides. Bright field micrographs. Vector Red staining, CB1; silver grains, neuropeptides. (a) Co-localization of CB1 and CRH mRNA in PVN. (b) Co-localization of CB1 and CART mRNA in PVN. (c) Co-localization of CB1 and prepro-orexin mRNA in LHA. (d) Co-localization of CB1 and MCH mRNA in LHA. Filled arrow, cell coexpressing CB1 and the respective neuropeptide; open arrow, cell expressing only the respective neuropeptide; asterisk, cell expressing only CB1 mRNA. Scale bars, 10 μm.
Figure 4
Figure 4
Altered expression of hypothalamic neuropeptides transcripts in CB1–/– mice. (a) Representative autoradiographic images showing upregulation of CRH mRNA in the PVN of CB1–/– hypothalamus. (b) Densitometric quantification by image analysis of areas of CRH mRNA expression as percentage of control by using four sections from seven animals in each group. *P < 0.05 vs. CB1+/+ control. (c) Representative autoradiographic images showing downregulation of CART mRNA in the DMN, LHA, and ARC of CB1–/– hypothalamus. (d) Densitometric quantification by image analysis of areas of CART mRNA expression as percentage of control by using four sections from seven animals in each group. **P < 0.005 vs. CB1+/+ control.
Figure 5
Figure 5
Functional CB1 is expressed in adipocytes. (a) RT-PCR for CB1 performed on CB1+/+ and CB1–/– epididymal fat pads. Ma, marker; lane 1, CB1+/+; lane 2, CB1–/–; lane 3, negative control for CB1+/+; lane 4, negative control for CB1–/–; lane 5, hippocampus; lane 6, water. (b) RT-PCR for CB1 performed on primary adipocyte cell cultures from C57BL/6N mice. Ma, marker; lane 1, C57BL/6N adipocytes; lane 2, negative control; lane 3, hippocampus; lane 4, water. (c) Effects of different doses of the CB1 agonist WIN-55,212 (WIN) and CB1 antagonist SR 141716A (SR) on heparin-releasable LPL activity (expressed as percentage of vehicle control) in primary adipocyte cells from C57BL/6N mice. *P < 0.05 compared with vehicle control. P < 0.05 compared with 10–6 M WIN.

Comment in

Similar articles

Cited by

References

    1. Flegal KM, Carroll MD, Ogden CL, Johnson CL. Prevalence and trends in obesity among US adults, 1999-2000. JAMA. 2002;288:1723–1727. - PubMed
    1. Yanovski SZ, Yanovski JA. Obesity. N. Engl. J. Med. 2002;346:591–602. - PubMed
    1. Zhang Y, et al. Positional cloning of the mouse obese gene and its human homologue. Nature. 1994;372:425–432. - PubMed
    1. Howlett AC, et al. International Union of Pharmacology. XXVII. Classification of cannabinoid receptors. Pharmacol. Rev. 2002;54:161–202. - PubMed
    1. Lutz B. Molecular biology of cannabinoid receptors. Prostaglandins Leukot. Essent. Fatty Acids. 2002;66:123–142. - PubMed

MeSH terms