Melanin-concentrating hormone is a critical mediator of the leptin-deficient phenotype
- PMID: 12897241
- PMCID: PMC187774
- DOI: 10.1073/pnas.1633636100
Melanin-concentrating hormone is a critical mediator of the leptin-deficient phenotype
Abstract
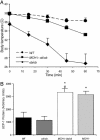
Energy homeostasis is regulated by a complex network involving peripheral and central signals that determine food intake and energy expenditure. Melanin-concentrating hormone (MCH) plays an essential role in this process. Animals treated with MCH develop hyperphagia and obesity. Ablation of the prepro-MCH gene leads to a lean phenotype, as does ablation of the rodent MCH receptor, MCHR-1. MCH is overexpressed in the leptin-deficient ob/ob mouse, and we hypothesized that ablation of MCH in this animal would lead to attenuation of its obese phenotype. Compared with ob/ob animals, mice lacking both leptin and MCH (double null) had a dramatic reduction in body fat. Surprisingly, the hyperphagia of the ob/ob mouse was unaffected. Instead, leanness was secondary to a marked increase in energy expenditure resulting from both increased resting energy expenditure and locomotor activity. Furthermore, double-null mice showed improvements in other parameters impaired in ob/ob mice. Compared with ob/ob mice, double-null animals had increased basal body temperature, improved response to cold exposure, lower plasma glucocorticoid levels, improved glucose tolerance, and reduced expression of stearoyl-CoA desaturase 1 (SCD-1). These results highlight the importance of MCH in integration of energy homeostasis downstream of leptin and, in particular, the role of MCH in regulation of energy expenditure.
Figures


Similar articles
-
Late-onset leanness in mice with targeted ablation of melanin concentrating hormone neurons.J Neurosci. 2006 Jan 11;26(2):389-97. doi: 10.1523/JNEUROSCI.1203-05.2006. J Neurosci. 2006. PMID: 16407534 Free PMC article.
-
Estradiol-induced anorexia is independent of leptin and melanin-concentrating hormone.Obes Res. 2004 Apr;12(4):716-24. doi: 10.1038/oby.2004.84. Obes Res. 2004. PMID: 15090642
-
Hypothalamic melanin-concentrating hormone is induced by cold exposure and participates in the control of energy expenditure in rats.Endocrinology. 2003 Nov;144(11):4831-40. doi: 10.1210/en.2003-0243. Epub 2003 Jul 24. Endocrinology. 2003. PMID: 12960043
-
Beyond skin color: emerging roles of melanin-concentrating hormone in energy homeostasis and other physiological functions.Peptides. 2004 Oct;25(10):1605-11. doi: 10.1016/j.peptides.2004.02.023. Peptides. 2004. PMID: 15476927 Review.
-
Functions of melanin-concentrating hormone in fish.J Exp Zool A Comp Exp Biol. 2006 Sep 1;305(9):751-60. doi: 10.1002/jez.a.310. J Exp Zool A Comp Exp Biol. 2006. PMID: 16902970 Review.
Cited by
-
New aspects of melanocortin signaling: a role for PRCP in α-MSH degradation.Front Neuroendocrinol. 2011 Jan;32(1):70-83. doi: 10.1016/j.yfrne.2010.09.001. Epub 2010 Oct 25. Front Neuroendocrinol. 2011. PMID: 20932857 Free PMC article. Review.
-
MCH neurons: vigilant workers in the night.Sleep. 2013 Dec 1;36(12):1783-6. doi: 10.5665/sleep.3198. Sleep. 2013. PMID: 24293751 Free PMC article. No abstract available.
-
Anorexia and impaired glucose metabolism in mice with hypothalamic ablation of Glut4 neurons.Diabetes. 2015 Feb;64(2):405-17. doi: 10.2337/db14-0752. Epub 2014 Sep 3. Diabetes. 2015. PMID: 25187366 Free PMC article.
-
Multifaceted actions of melanin-concentrating hormone on mammalian energy homeostasis.Nat Rev Endocrinol. 2021 Dec;17(12):745-755. doi: 10.1038/s41574-021-00559-1. Epub 2021 Oct 4. Nat Rev Endocrinol. 2021. PMID: 34608277 Review.
-
Brain Regulation of Energy Metabolism.Endocrinol Metab (Seoul). 2016 Dec;31(4):519-524. doi: 10.3803/EnM.2016.31.4.519. Endocrinol Metab (Seoul). 2016. PMID: 28029023 Free PMC article. Review.
References
-
- Bittencourt, J. C., Presse, F., Arias, C., Peto, C., Vaughan, J., Nahon, J. L., Vale, W. & Sawchenko, P. E. (1992) J. Comp. Neurol. 319, 218–245. - PubMed
-
- Qu, D., Ludwig, D. S., Gammeltoft, S., Piper, M., Pelleymounter, M. A., Cullen, M. J., Mathes, W. F., Przypek, R., Kanarek, R. & Maratos-Flier, E. (1996) Nature 380, 243–247. - PubMed
-
- Shimada, M., Tritos, N. A., Lowell, B. B., Flier, J. S. & Maratos-Flier, E. (1998) Nature 396, 670–674. - PubMed
-
- Rossi, M., Choi, S. J., O'Shea, D., Miyoshi, T., Ghatei, M. A. & Bloom, S. R. (1997) Endocrinology 138, 351–355.O. S. - PubMed
Publication types
MeSH terms
Substances
Grants and funding
LinkOut - more resources
Full Text Sources
Other Literature Sources
Molecular Biology Databases
Miscellaneous

