

Activation tagging in tomato identifies a transcriptional regulator of anthocyanin biosynthesis, modification, and transport
- PMID: 12897245
- PMCID: PMC167162
- DOI: 10.1105/tpc.012963
Activation tagging in tomato identifies a transcriptional regulator of anthocyanin biosynthesis, modification, and transport
Abstract
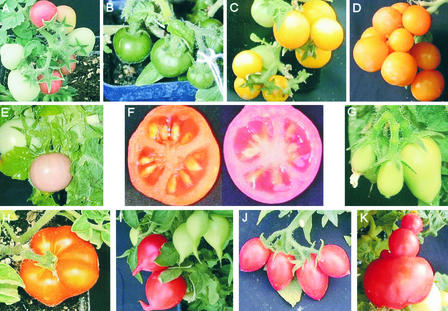
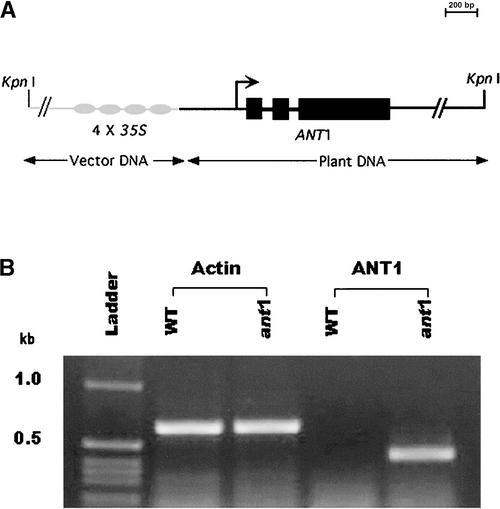
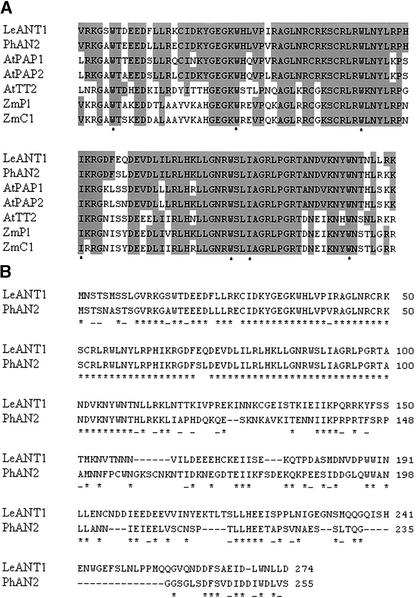
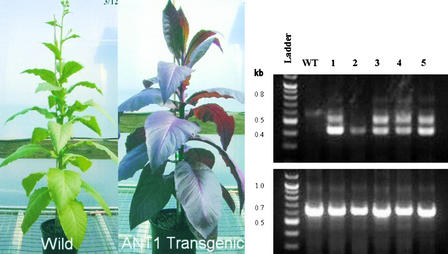
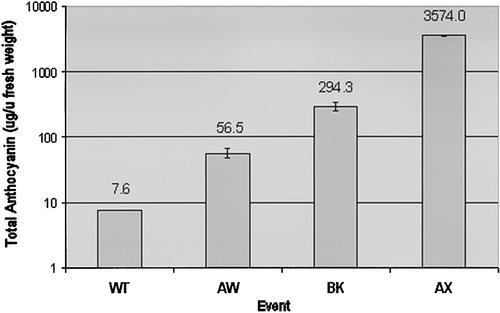
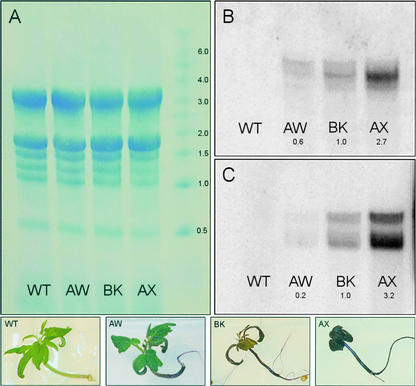
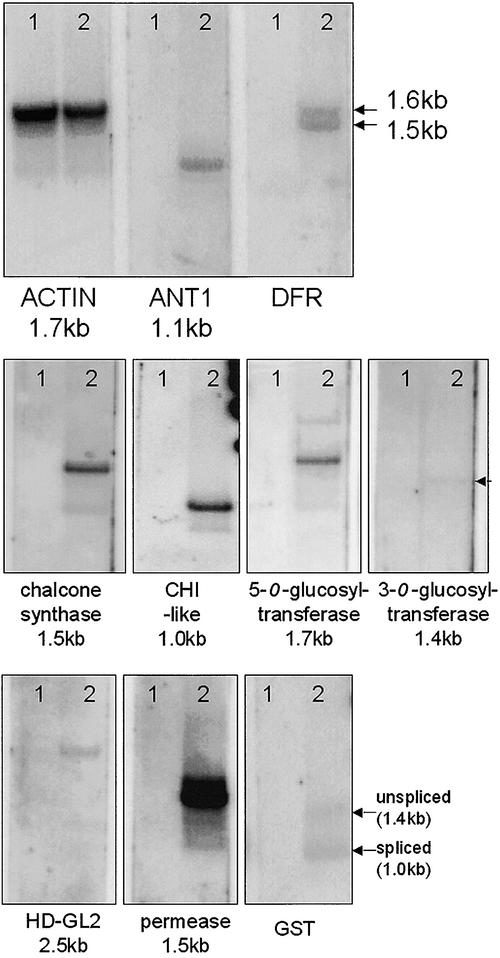
We have developed a high-throughput T-DNA insertional mutagenesis program in tomato using activation tagging to identify genes that regulate metabolic pathways. One of the activation-tagged insertion lines (ant1) showed intense purple pigmentation from the very early stage of shoot formation in culture, reflecting activation of the biosynthetic pathway leading to anthocyanin accumulation. The purple coloration resulted from the overexpression of a gene that encodes a MYB transcription factor. Vegetative tissues of ant1 plants displayed intense purple color, and the fruit showed purple spotting on the epidermis and pericarp. The gene-to-trait relationship of ant1 was confirmed by the overexpression of ANT1 in transgenic tomato and in tobacco under the control of a constitutive promoter. Suppression subtractive hybridization and RNA hybridization analysis of the purple tomato plants indicated that the overexpression of ANT1 caused the upregulation of genes that encode proteins in both the early and later steps of anthocyanidin biosynthesis as well as genes involved in the glycosylation and transport of anthocyanins into the vacuole.
Figures


Similar articles
-
ANTHOCYANIN1 from Solanum chilense is more efficient in accumulating anthocyanin metabolites than its Solanum lycopersicum counterpart in association with the ANTHOCYANIN FRUIT phenotype of tomato.Theor Appl Genet. 2012 Feb;124(2):295-307. doi: 10.1007/s00122-011-1705-6. Epub 2011 Sep 23. Theor Appl Genet. 2012. PMID: 21947299
-
A constitutively expressed Myc-like gene involved in anthocyanin biosynthesis from Perilla frutescens: molecular characterization, heterologous expression in transgenic plants and transactivation in yeast cells.Plant Mol Biol. 1999 Sep;41(1):33-44. doi: 10.1023/a:1006237529040. Plant Mol Biol. 1999. PMID: 10561066
-
Molecular aspects of Anthocyanin fruit tomato in relation to high pigment-1.J Hered. 2008 May-Jun;99(3):292-303. doi: 10.1093/jhered/esm128. Epub 2008 Mar 15. J Hered. 2008. PMID: 18344529
-
Alternative Splicing in the Anthocyanin Fruit Gene Encoding an R2R3 MYB Transcription Factor Affects Anthocyanin Biosynthesis in Tomato Fruits.Plant Commun. 2019 Oct 31;1(1):100006. doi: 10.1016/j.xplc.2019.100006. eCollection 2020 Jan 13. Plant Commun. 2019. PMID: 33404542 Free PMC article.
-
In pursuit of purple: anthocyanin biosynthesis in fruits of the tomato clade.Trends Plant Sci. 2024 May;29(5):589-604. doi: 10.1016/j.tplants.2023.12.010. Epub 2024 Jan 4. Trends Plant Sci. 2024. PMID: 38177013 Review.
Cited by
-
Genetic and Biotechnological Approaches to Improve Fruit Bioactive Content: A Focus on Eggplant and Tomato Anthocyanins.Int J Mol Sci. 2024 Jun 20;25(12):6811. doi: 10.3390/ijms25126811. Int J Mol Sci. 2024. PMID: 38928516 Free PMC article. Review.
-
Synergistic effects of GhSOD1 and GhCAT1 overexpression in cotton chloroplasts on enhancing tolerance to methyl viologen and salt stresses.PLoS One. 2013;8(1):e54002. doi: 10.1371/journal.pone.0054002. Epub 2013 Jan 15. PLoS One. 2013. PMID: 23335985 Free PMC article.
-
Characterization of a potato activation-tagged mutant, nikku, and its partial revertant.Planta. 2015 Jun;241(6):1481-95. doi: 10.1007/s00425-015-2272-x. Epub 2015 Mar 13. Planta. 2015. PMID: 25772042
-
The similar and different evolutionary trends of MATE family occurred between rice and Arabidopsis thaliana.BMC Plant Biol. 2016 Sep 26;16(1):207. doi: 10.1186/s12870-016-0895-0. BMC Plant Biol. 2016. PMID: 27669820 Free PMC article.
-
Expression of the R2R3-MYB transcription factor TaMYB14 from Trifolium arvense activates proanthocyanidin biosynthesis in the legumes Trifolium repens and Medicago sativa.Plant Physiol. 2012 Jul;159(3):1204-20. doi: 10.1104/pp.112.195420. Epub 2012 May 7. Plant Physiol. 2012. PMID: 22566493 Free PMC article.
References
-
- Beck, E., Ludwig, G., Auerswald, E., Reiss, B., and Schaller, H. (1982). Nucleotide sequence and exact location of the neomycin phosphotransferase gene from transposon Tn5. Gene 19, 327–336. - PubMed
-
- Bongue-Bartelsman, M., O'Neill, S.D., Tong, Y., and Yoder, J.I. (1994). Characterization of the gene encoding dihydroflavonol 4-reductase in tomato. Gene 138, 153–157. - PubMed
MeSH terms
Substances
LinkOut - more resources
Full Text Sources
Other Literature Sources
