. 2003 Sep 7;224(1):1-8.
doi: 10.1016/s0022-5193(03)00228-5.

SARS outbreaks in Ontario, Hong Kong and Singapore: the role of diagnosis and isolation as a control mechanism

Affiliations

SARS outbreaks in Ontario, Hong Kong and Singapore: the role of diagnosis and isolation as a control mechanism

G Chowell et al. J Theor Biol. .

Abstract

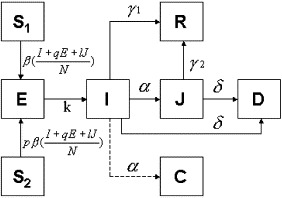
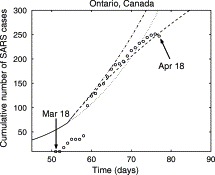
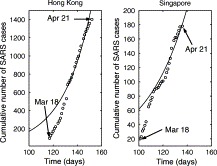
In this article we use global and regional data from the SARS epidemic in conjunction with a model of susceptible, exposed, infective, diagnosed, and recovered classes of people ("SEIJR") to extract average properties and rate constants for those populations. The model is fitted to data from the Ontario (Toronto) in Canada, Hong Kong in China and Singapore outbreaks and predictions are made based on various assumptions and observations, including the current effect of isolating individuals diagnosed with SARS. The epidemic dynamics for Hong Kong and Singapore appear to be different from the dynamics in Toronto, Ontario. Toronto shows a very rapid increase in the number of cases between March 31st and April 6th, followed by a significant slowing in the number of new cases. We explain this as the result of an increase in the diagnostic rate and in the effectiveness of patient isolation after March 26th. Our best estimates are consistent with SARS eventually being contained in Toronto, although the time of containment is sensitive to the parameters in our model. It is shown that despite the empirically modeled heterogeneity in transmission, SARS' average reproductive number is 1.2, a value quite similar to that computed for some strains of influenza (J. Math. Biol. 27 (1989) 233). Although it would not be surprising to see levels of SARS infection higher than 10% in some regions of the world (if unchecked), lack of data and the observed heterogeneity and sensitivity of parameters prevent us from predicting the long-term impact of SARS. The possibility that 10 or more percent of the world population at risk could eventually be infected with the virus in conjunction with a mortality rate of 3-7% or more, and indications of significant improvement in Toronto support the stringent measures that have been taken to isolate diagnosed cases.


Figures

Fig. 1
Fig. 1
A schematic representation of the flow of individuals between the different classes. The model considers two distinct susceptible classes: S1, the most susceptible, and S2. β (I+qE+lJ)/N is the transmission rate to S1 from E, I and J. p is a measure of reduced susceptibility to SARS in class S2. E is the class composed of asymptomatic, possibly infectious individuals. The class I denotes infected, symptomatic, infectious, and undiagnosed individuals. I-individuals move into the diagnosed class J at the rate α. Individuals recover from class I at the rate γ1 and γ2 from the J class. The rate δ is SARS’ disease-induced mortality. The classes R and D are included to keep track of the cumulative number of diagnosed, recovered and dead individuals, respectively. The quantity C is for comparison with epidemiological statistics; it tracks the total number of diagnosed individuals.
Fig. 2
Fig. 2
The cumulative number of SARS cases from March 31 to April 14 (lin-log scale) for the World (top data), Hong Kong (second row), Ontario, Canada (fourth row), all of Canada (third row) and Singapore (bottom row). The data were obtained from WHO (World Health Organization, 2003) except for the Canadian data which are from the Canadian Ministry of Health (2003). The Ontario data includes suspected and probable cases since March 31. This inclusion explains the jump in the data for Ontario on March 31st. The rates of growth of the SARS outbreak (computed using data from March 31 to April 14) are: 0.041 (world), 0.050 (Hong Kong), 0.037 (Singapore), 0.054 (Canada) and 0.054 (Ontario).
Fig. 3
Fig. 3
The circles are the cumulative number of suspected or probable SARS cases in Ontario beginning on day 61 (March 31st, the day of the jump) and the number of probable cases up until day 60. The data prior to day 61 only bound the model from below. The lines are the cumulative number of “diagnosed” cases C from the SEIJR model (C is the running sum of all diagnosed cases J). The fit to the data is given by a change in the values of α and l on March 26th. Prior to March 26th, α=1/6, l=0.76. Because the model is poorly constrained prior to day 61, the real purpose of this part of the model is to generate sufficiently large classes of E and I relative to J on March 26th to give the fast increase in C from day 61 to day 67. After March 26th, three scenarios are shown. The fit to the data is given by α=1/3, l=0.05 (rapid diagnosis and effective isolation of diagnosed cases, dashed line). The second curve is given by α=1/6, l=0.05 (slow diagnosis and effective isolation, dotted line) and the third curve by α=1/3, l=0.3 (rapid diagnosis with improved but imperfect isolation, dash–dot line). An index case is assumed on February 1st. The transmission rate β is computed using the estimated rate of growth (r=0.0543) for the Ontario data as described in the text.
Fig. 4
Fig. 4
Cumulative number of SARS cases in Hong Kong and Singapore as a function of time (SEIJR model) with l=0.38 (Hong Kong) and l=0.40 (Singapore). Singapore has β=0.68, all other parameter are from Table 1. The data are fitted starting March 31 (see Fig. 2) because of the jump in reporting on March 30th.

References

    1. Anderson R.M., May R.M. Infectious Diseases of Humans. Oxford University Press; Oxford: 1991.
    1. BBC News, 2003. Ministers may review SARS status. http://news.bbc.co.uk/1/hi/health/2979623.stm, 27th April.
    1. Bradsher, K., 2003a. Carrier of SARS made 7 flights before treatment. The New York Times, 11th April.
    1. Bradsher, K., 2003b. SARS is here to stay, Hong Kong and Singapore tell citizens. The New York Times, 8th April.
    1. Brauer F., Castillo-Chavez C. Mathematical Models in Population Biology and Epidemiology. Springer; New York: 2000.

Publication types

LinkOut - more resources