

A gene expression-based method to diagnose clinically distinct subgroups of diffuse large B cell lymphoma
- PMID: 12900505
- PMCID: PMC187912
- DOI: 10.1073/pnas.1732008100
A gene expression-based method to diagnose clinically distinct subgroups of diffuse large B cell lymphoma
Abstract
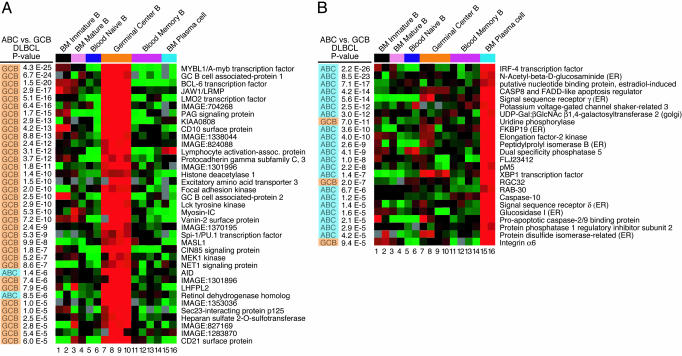
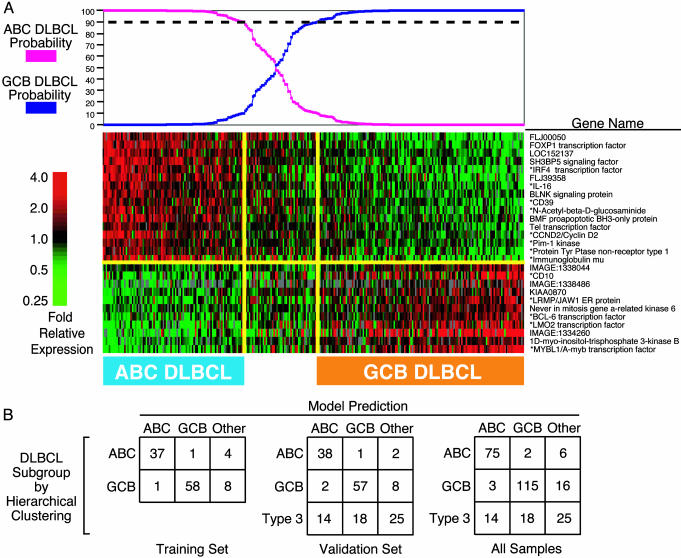
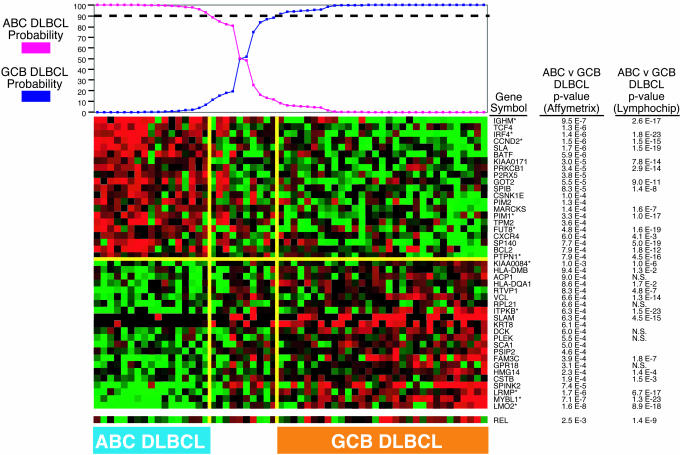
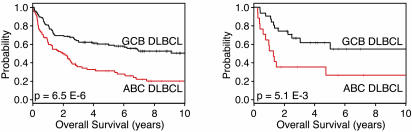
To classify cancer specimens by their gene expression profiles, we created a statistical method based on Bayes' rule that estimates the probability of membership in one of two cancer subgroups. We used this method to classify diffuse large B cell lymphoma (DLBCL) biopsy samples into two gene expression subgroups based on data obtained from spotted cDNA microarrays. The germinal center B cell-like (GCB) DLBCL subgroup expressed genes characteristic of normal germinal center B cells whereas the activated B cell-like (ABC) DLBCL subgroup expressed a subset of the genes that are characteristic of plasma cells, particularly those encoding endoplasmic reticulum and golgi proteins involved in secretion. We next used this predictor to discover these subgroups within a second set of DLBCL biopsies that had been profiled by using oligonucleotide microarrays [Shipp, M. A., et al. (2002) Nat. Med. 8, 68-74]. The GCB and ABC DLBCL subgroups identified in this data set had significantly different 5-yr survival rates after multiagent chemotherapy (62% vs. 26%; P < or = 0.0051), in accord with analyses of other DLBCL cohorts. These results demonstrate the ability of this gene expression-based predictor to classify DLBCLs into biologically and clinically distinct subgroups irrespective of the method used to measure gene expression.
Figures
Comment in
-
Extending the utility of gene profiling data by bridging microarray platforms.Proc Natl Acad Sci U S A. 2003 Sep 16;100(19):10585-7. doi: 10.1073/pnas.2034937100. Epub 2003 Sep 8. Proc Natl Acad Sci U S A. 2003. PMID: 12963810 Free PMC article. No abstract available.
References
-
- Alizadeh, A. A., Eisen, M. B., Davis, R. E., Ma, C., Lossos, I. S., Rosenwald, A., Boldrick, J. C., Sabet, H., Tran, T., Yu, X., et al. (2000) Nature 403, 503–511. - PubMed
-
- Rosenwald, A., Wright, G., Chan, W. C., Connors, J. M., Campo, E., Fisher, R. I., Gascoyne, R. D., Muller-Hermelink, H. K., Smeland, E. B., Giltnane, J. M., et al. (2002) N. Engl. J. Med. 346, 1937–1947. - PubMed
-
- Shipp, M. A., Ross, K. N., Tamayo, P., Weng, A. P., Kutok, J. L., Aguiar, R. C. T., Gaasenbeek, M., Angelo, M., Reich, M., Pinkus, G. S., et al. (2002) Nat. Med. 8, 68–74. - PubMed
-
- Radmacher, M. D., McShane, L. M. & Simon, R. (2002) J. Comput. Biol. 9, 505–511. - PubMed
-
- Hills, M. (1966) J. R. Stat. Soc. B 28, 1–31.
MeSH terms
LinkOut - more resources
Full Text Sources
Other Literature Sources
