. 2003 Aug 4;198(3):411-21.
doi: 10.1084/jem.20021384.

Peroxisome proliferator-activated receptors alpha and gamma down-regulate allergic inflammation and eosinophil activation

Affiliations

Peroxisome proliferator-activated receptors alpha and gamma down-regulate allergic inflammation and eosinophil activation

Gaetane Woerly et al. J Exp Med. .

Abstract

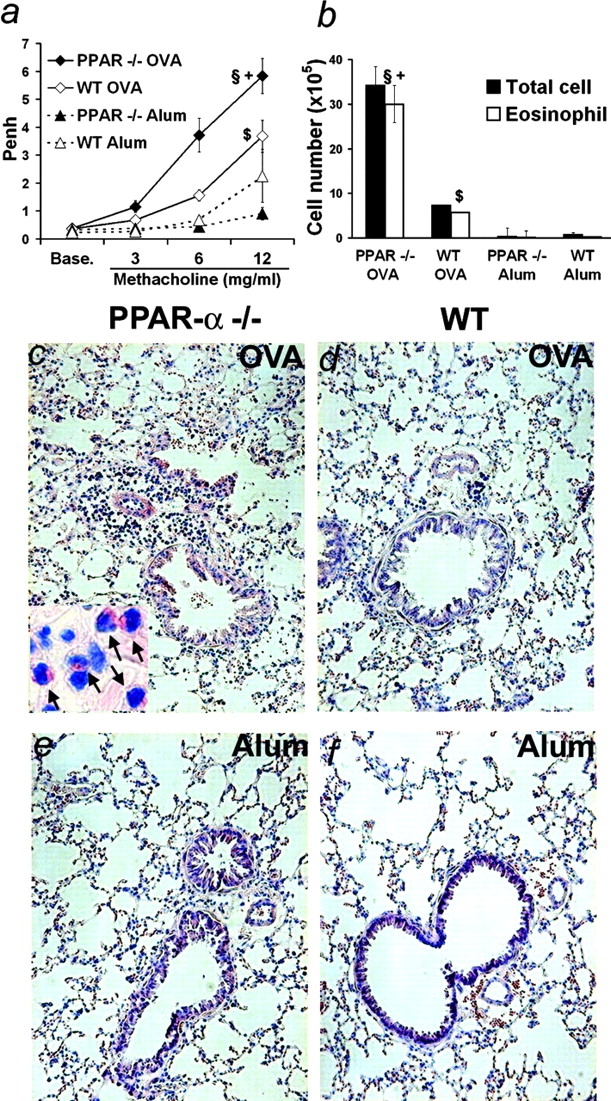
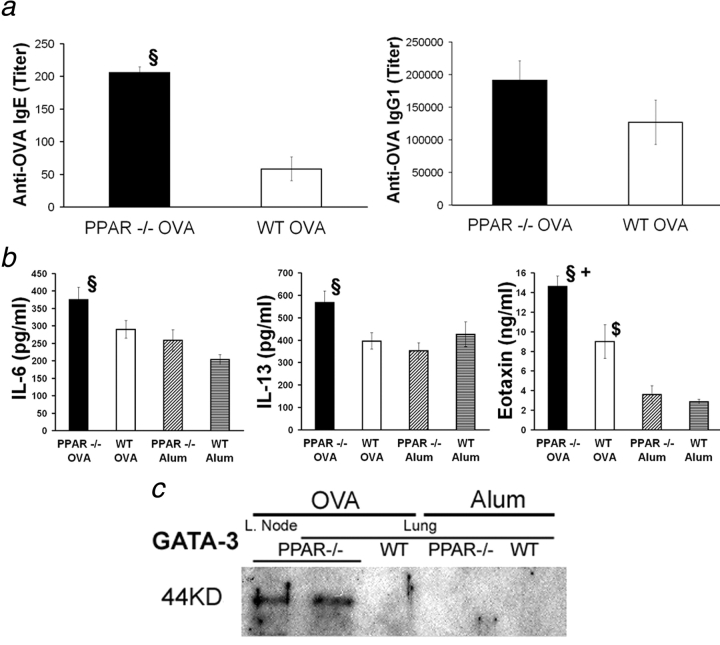
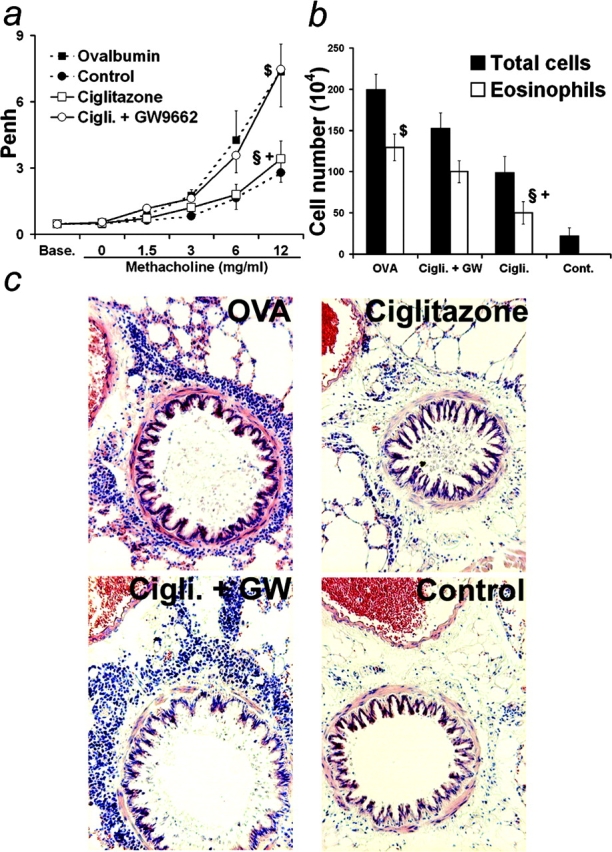
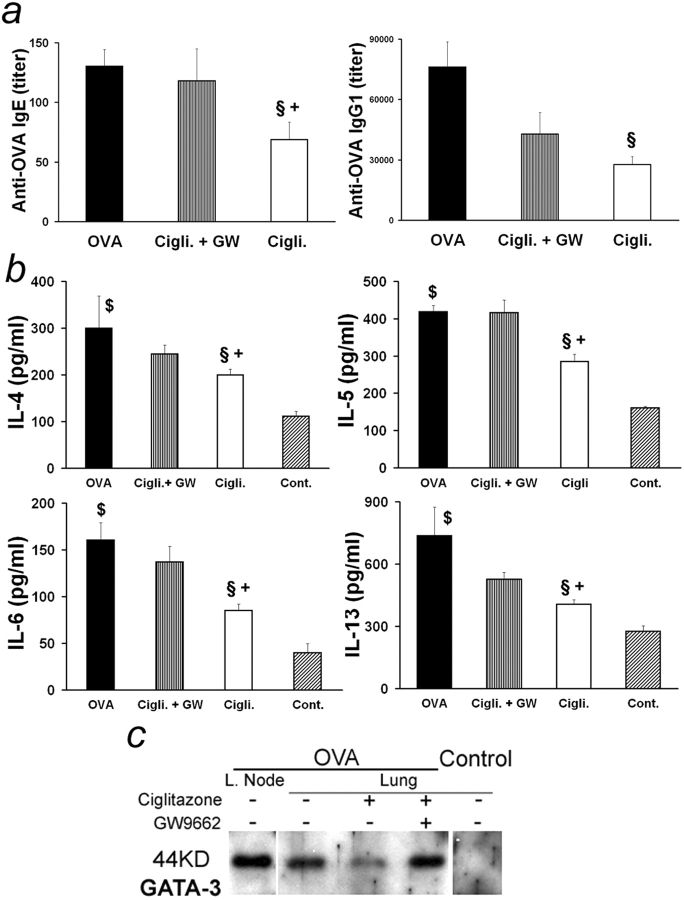
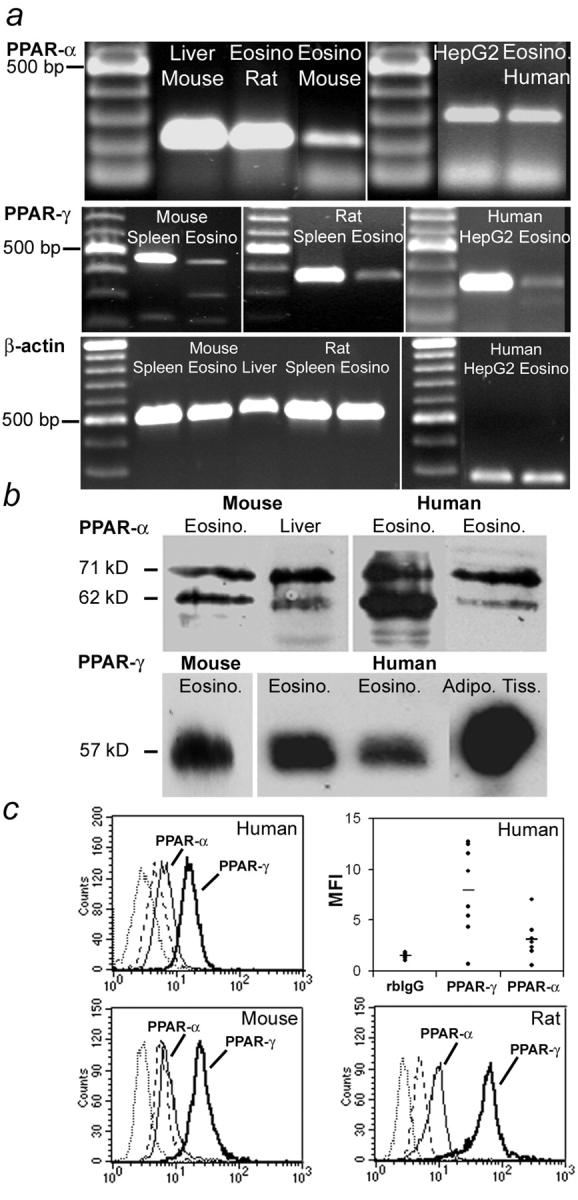
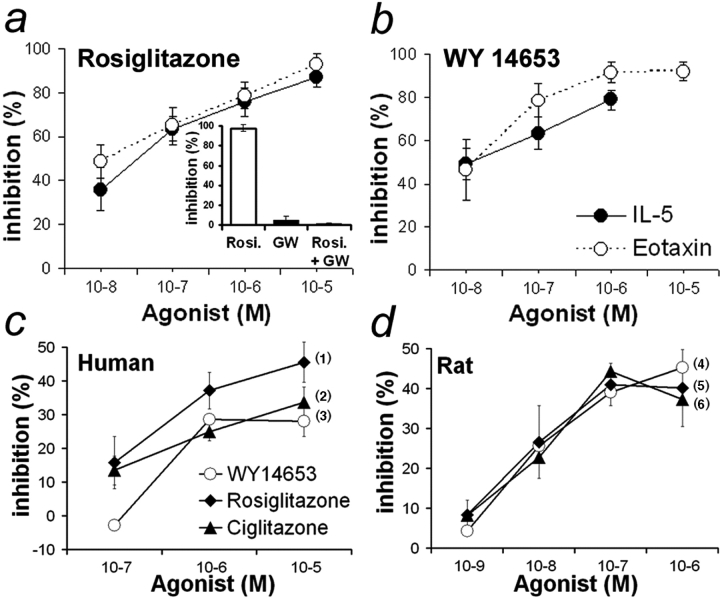
Allergic asthma is characterized by airway hyperresponsiveness, eosinophilia, and mucus accumulation and is associated with increased IgE concentrations. We demonstrate here that peroxisome proliferator-activated receptors (PPARs), PPAR-alpha and PPAR-gamma, which have been shown recently to be involved in the regulation of various cell types within the immune system, decrease antigen-induced airway hyperresponsiveness, lung inflammation, eosinophilia, cytokine production, and GATA-3 expression as well as serum levels of antigen-specific IgE in a murine model of human asthma. In addition, we demonstrate that PPAR-alpha and -gamma are expressed in eosinophils and their activation inhibits in vitro chemotaxis and antibody-dependent cellular cytotoxicity. Thus, PPAR-alpha and -gamma (co)agonists might be of therapeutic interest for the regulation of allergic or inflammatory reactions by targeting both regulatory and effector cells involved in the immune response.


Figures

Figure 1.
Figure 1.
Increased asthma-like reactions in PPAR-α−/− mice. (a) AHR of OVA-sensitized and -challenged or unsensitized but challenged PPAR-α−/− or corresponding WT animals to increasing methacholine concentrations 48 h after the last OVA nebulization. (b) Cellularity and eosinophilia in BALs at the time of sacrifice. (n = 4–13 animals per group. Data expressed as mean ± SEM; some bars may fall within mark). §, Statistically different from OVA-sensitized and aerosol-challenged WT animals. +, Statistically different from unsensitized but aerosol challenged PPAR-α−/− mice. $, Statistically different from unsensitized but aerosol challenged WT mice (see Table I for P values). (c–f) May Grünwald Giemsa staining of lung sections from OVA-sensitized and aerosol-challenged (c and d) or unsensitized but aerosol-challenged (e and f) PPAR-α−/− (c and e) or WT (d and f) mice (original magnification 100). Inset: arrows indicate eosinophils (original magnification 400).
Figure 2.
Figure 2.
Increased lung inflammation and humoral response in PPAR-α−/− mice. (a) Serum OVA-specific IgE (left) and IgG1 (right) from animals treated as in Fig. 1 24 h after the last OVA nebulization. (b) IL-6, -13, and eotaxin content from lung extracts from animals treated as in Fig. 1. (n = 4–13 animals per group. Data expressed as mean ± SEM; some bars may fall within mark.) §, Statistically different from OVA-sensitized and aerosol-challenged WT animals. +, Statistically different from unsensitized but aerosol-challenged PPAR-α−/− mice. $, Statistically different from unsensitized but aerosol-challenged WT mice (see Table I for P values). (c) Western blot analysis of GATA-3 expression in lung extracts (and lymph nodes [L. Node]) from individual animals treated as in Fig. 1.
Figure 3.
Figure 3.
Regulation of asthma-like reactions by PPAR-γ. Mice were sensitized by intraperitoneal injection of OVA in alum and challenged by repeated nebulizations of OVA together with nebulization with 5 × 10⁻⁵ M ciglitazone, 5 × 10⁻⁵ M ciglitazone and 5 × 10⁻⁵ M GW9662 or vehicle. Unsensitized control animals received alum only and were challenged with OVA as for sensitized animals. (a) AHR to increasing methacholine concentrations 48 h after the last nebulization. (b) Cellularity and eosinophilia in BALs at the time of sacrifice. (n = 4–8 animals per group; data expressed as mean ± SEM, some bars may fall within mark). §: Statistically different from OVA-sensitized and aerosol-challenged animals. +: Statistically different from OVA-sensitized and aerosol-challenged mice treated with both ciglitazone and GW9662. $: Statistically different from unsensitized but aerosol challenged mice (see Table I for P values). (c) May Grünwald Giemsa staining of lung sections from sensitized mice nebulized with OVA together with vehicle (upper left), with 5 × 10⁻⁵ M ciglitazone (upper right) or with 5 × 10⁻⁵ M ciglitazone and 5 × 10⁻⁵ M GW9662 (lower left) and from unsensitized animals (lower right) (original magnification 100).
Figure 4.
Figure 4.
Regulation of pulmonary inflammation and humoral response by PPAR-γ. (a) Serum OVA-specific IgE (left) and IgG1 (right) from animals treated as in Fig. 3 24 h after the last OVA nebulization. (b) IL-4, -5, -6, and -13 content of lung extracts from animals treated as in Fig. 3. (n = 4–19 animals per group. Data expressed as mean ± SEM; some bars may fall within mark.) §, Statistically different from OVA-sensitized and aerosol-challenged animals. +, Statistically different from OVA-sensitized and aerosol-challenged mice treated with both ciglitazone and GW9662. $, Statistically different from unsensitized but aerosol-challenged mice (see Table I for P values). (c) Western blot analysis of GATA-3 expression in lung extracts (and lymph nodes [L. Node]) from individual animals treated as in Fig. 3.
Figure 5.
Figure 5.
PPAR expression in eosinophils. (a) RT-PCR amplification of PPAR-α (top), PPAR-γ (middle), and β-actin (bottom) mRNA from human, mouse, and rat eosinophils. (top) Total WT mouse liver, rat peritoneal eosinophils, and eosinophils from IL-5 Tg mouse spleen (amplicon size: 215 bp; left). HepG2 cells and human peripheral blood eosinophils (amplicon size: 304 bp; right). (middle) Total WT mouse spleen and eosinophils from IL-5 Tg mouse spleen (amplicon size: 473 bp; left). Total rat spleen and rat peritoneal eosinophils (amplicon size: 343 bp; center). HepG2 cells and human peripheral blood eosinophils (amplicon size: 337 bp; right). (bottom) Total WT mouse spleen, eosinophils from IL-5 Tg mouse spleen, total WT mouse liver, total rat spleen, and peritoneal rat eosinophils (amplicon size: 532 bp; left). Human peripheral blood eosinophils and HepG2 cells (amplicon size: 238 bp; right). (b) Identification of PPAR-α (top) and PPAR-γ (bottom) proteins in human and mouse eosinophil lysates by Western blot analysis. Immunodetection of PPAR-α and PPAR-γ in cell lysates from IL-5 Tg mouse eosinophils and WT mouse liver or human peripheral blood eosinophils from two different donors and adipose tissue after SDS-PAGE and transfer on membrane. (c) Detection of PPAR-α and PPAR-γ by flow cytometry on permeabilized human (top), mouse (bottom left), and rat eosinophils (bottom right). Relative expression levels of PPAR-α and PPAR-γ in eosinophils from eight donors with hypereosinophilia (mean fluorescence intensity [MFI]; control rabbit IgG (rbIgG); average value is represented by the horizontal bar in each group). On histogram plots, anti–PPAR-α (thin line), anti–PPAR-γ (thick line), control rabbit IgG (dotted line), and FITC-conjugated secondary antibody (dashed line).
Figure 6.
Figure 6.
Regulation of eosinophil function by PPAR in vitro. (a and b) Inhibition of eosinophil chemotaxis by PPAR. Dose-dependent inhibition of IL-5– and eotaxin-induced chemotaxis of human peripheral blood eosinophils by rosiglitazone (a) and WY14653 (b). P < 0.0001 for each agonist with both chemoattractants versus untreated cells. Inset: Abrogation of rosiglitazone inhibition of IL-5–induced chemotaxis by GW9662 (concentration of each compound 10−5 M). (c and d) Inhibition of eosinophil-mediated ADCC by PPAR agonists. Dose-dependent inhibition of human (c) or rat (d) eosinophil-mediated ADCC toward S. mansoni larvae by WY14653, ciglitazone, and rosiglitazone (n = 3–8 independent experiments; data expressed as mean ± SEM). (1) and (5) P < 0.0001 for rosiglitazone-treated versus vehicle-treated cells; (2) P = 0.034 and (6) P < 0.0001 for ciglitazone-treated versus vehicle-treated cells; (3) P = 0.037 and (4) P < 0.0001 for WY14653-treated versus vehicle-treated cells.

References

    1. Wills-Karp, M. 1999. Immunologic basis of antigen-induced airway hyperresponsiveness. Annu. Rev. Immunol. 17:255–281. - PubMed
    1. Maddox, L., and D.A. Schwartz. 2002. The pathophysiology of asthma. Annu. Rev. Med. 53:477–498. - PubMed
    1. Dombrowicz, D., and M. Capron. 2001. Eosinophils, allergy and parasites. Curr. Opin. Immunol. 13:716–720. - PubMed
    1. Desvergne, B., and W. Wahli. 1999. Peroxisome proliferator-activated receptors: nuclear control of metabolism. Endocr. Rev. 20:649–688. - PubMed
    1. Devchand, P.R., H. Keller, J.M. Peters, M. Vazquez, F.J. Gonzalez, and W. Wahli. 1996. The PPAralpha-leukotriene B4 pathway to inflammation control. Nature. 384:39–43. - PubMed

Publication types

MeSH terms