Comparative Study
. 2003 Aug 19;100(17):9820-5.
doi: 10.1073/pnas.1631550100. Epub 2003 Aug 5.

Single-molecule study of DNA unlinking by eukaryotic and prokaryotic type-II topoisomerases

Affiliations
Comparative Study

Single-molecule study of DNA unlinking by eukaryotic and prokaryotic type-II topoisomerases

G Charvin et al. Proc Natl Acad Sci U S A. .

Abstract

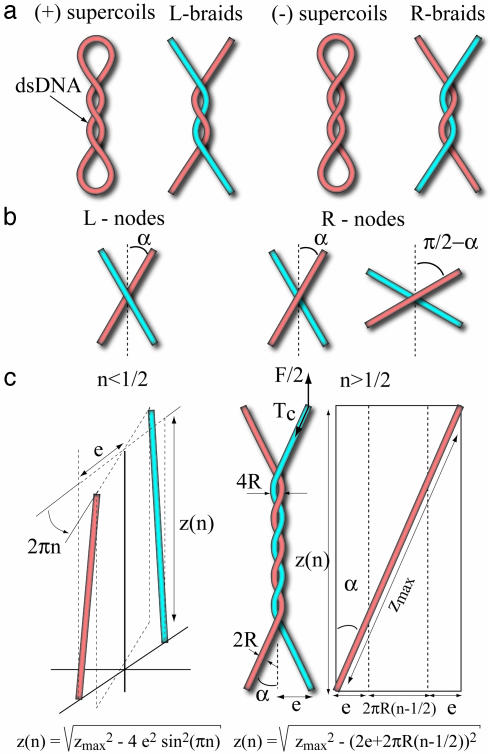
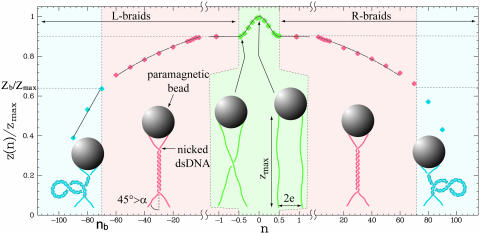
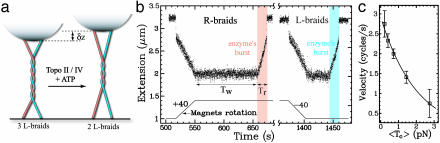
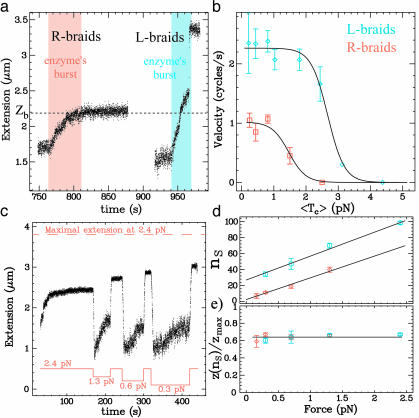
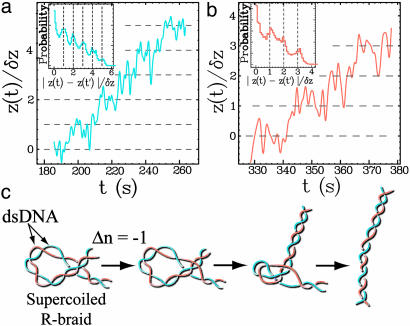
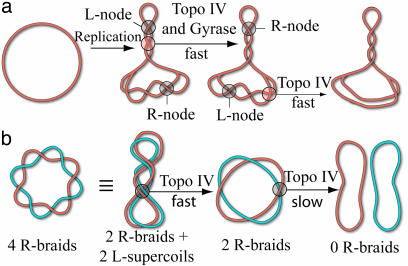
Type-II topoisomerases are responsible for untangling DNA during replication by removing supercoiled and interlinked DNA structures. Using a single-molecule micromanipulation setup, we follow the real-time decatenation of two mechanically braided DNA molecules by Drosophila melanogaster topoisomerase (Topo) II and Escherichia coli Topo IV. Although Topo II relaxes left-handed (L) and right-handed (R-) braids similarly at a rate of approximately 2.9 s-1, Topo IV has a marked preference for L-braids, which it relaxes completely and processively at a rate of approximately 2.4 s-1. However, Topo IV can unlink R-braids at about half that rate when they supercoil to form L-plectonemes. These results imply that the preferred substrate for unlinking by Topo IV has the symmetry of an L-crossing and shed new light on the decatenation of daughter strands during DNA replication, which are usually assumed to be linked in an R-braid.


Figures

Fig. 1.
Fig. 1.
DNA crossings and geometrical model of DNA braiding. (a) Similarity of the crossings between a positively (negatively) supercoiled plasmid and L- (R-)braids. Note that overtwisting the (R-) double-stranded DNA (dsDNA) molecule generates (+) supercoils that are left-handed. (b) Diagram of the crossing of two DNA strands. 2α denotes the angle between strands; notice that an R-node with an obtuse angle π – 2α is identical to an L-node with an acute angle 2α < π/2, which is characteristic of the geometry of crossings in (+) supercoiled DNA. (c Left) Twisting two molecules by less than half a turn (0 < n < 1/2) so they do not cross. 2e denotes the distance between the molecules' anchoring points, zmax denotes their length, and z(n) denotes their vertical extension; a direct application of Pythagoras' theorem yields the equation for z(n). (Right) Case n > 1/2 when the two molecules are wrapped around each other. The axis of each molecule traces a helicoidal path on an imaginary cylinder of radius R. By describing that path in periodic cylindrical coordinates (schema on the far right), one notices that its azimuthal projection is 2πR(n – 1/2) + 2e. The equation for its vertical projection z(n) is then obtained from Pythagoras' theorem. The tension Tc in each molecule is given by Tc = F/(2 cos α).
Fig. 2.
Fig. 2.
Braiding of two DNA molecules. Shown are two DNA molecules anchored to a magnetic bead. By rotating the bead by n turns, the molecules are braided around each other, and their extension z decreases from their maximal value zmax at n = 0. Plotted: the molecules' relative extension z/zmax vs. n at F = 1.15 pN (points). Notice the change in the horizontal scale when –1 < n < 1. There is a sharp decrease in extension for the first half turn (|n| < 1/2, green shaded area), i.e., until the two molecules cross, followed (for |n| > 1/2, red shaded area) by a more gradual decrease as they wrap around each other. The plain black lines are a best fit to the data using the geometrical model (described in Fig. 1c and Materials and Methods). For relative extensions z/zmax < zb/zmax ∼ 0.64 (blue shaded area), the braids in close contact supercoil leading to a decrease in extension δz ∼ 42 nm per turn (15).
Fig. 3.
Fig. 3.
Decatenation by Topo II. (a) The sketch shows that when braids are decatenated, the distance z of the bead to the surface increases by δz per braid removed. The kinetics of decatenation can thus be monitored in real-time by measuring z. (b) Recording of a decatenation experiment using Topo II (raw extension signal z at 25 Hz). Rotation of the magnets by 40 turns (bottom trace) leads to a decrease in the DNA's extension z; see Fig. 2. After waiting for a time Tw, the processive decatenation of the two molecules by a single enzyme is observed (shaded time interval) as an increase in extension within a relaxation time Tr < Tw. The data shown are time traces of the decatenation by Topo II of R-braids (red shaded area) and L-braids (blue shaded area) starting at |n| = 40 (F = 1.15 pN). No significant difference was observed between relaxation of R- and L-nodes. Notice the sharp increase in z at the end of the relaxation run resulting from the decatenation of the last braid. (c) Variation with the average tension 〈Tc〉 of the decatenation velocity vd. Each point is an average over at least 10 runs at a given force. The data are fit by an exponential curve (plain line): formula image with formula image cycles/s, Δ = 1.9 nm (12). The error bars here, as in all plots, indicate the statistical error.
Fig. 4.
Fig. 4.
Decatenation by Topo IV. (a) Time traces of relaxation by Topo IV of R-braids (red shaded area; initial n = 45) and L-braids (blue shaded area; initial n = 55) at F = 0.7 pN. Whereas L-braids are completely relaxed, R-braids are relaxed only partially: the reaction stops at a final nnS = 19 at which z(nS)/zmax = 0.66. The value of the extension zb where braids begin to supercoil (see Fig. 2) is shown for comparison. (b) Variation with the averaged tension 〈Tc〉 of the decatenation rate vd (averaged over at least 10 runs at each force) for R-braids (red, □) and L-braids (blue, ⋄) and fit (plain line) to a model where the rate-limiting step of the reaction is force-independent (30): vd = v0/(1 + k exp(〈Tc〉Δ/kBT)); with formula image cycle/s, Δ = 15.4 nm, kR= 3.103(R-braids) and formula image cycle/s, Δ = 15.4 nm, kL= 3.105(L-braids). (c) Time trace obtained when varying the force during decatenation of R-braids by Topo IV. After the decatenation stopped at F = 2.4 pN, the force was reduced to F = 1.3 pN. Decatenation resumed, then stopped again. The force was increased back to F = 2.4 pN to allow for comparison of the molecule's initial and final extension. The procedure was repeated at F = 0.6 pN and F = 0.3 pN. (d) The remaining catenation number at arrest nS vs. F for two different sets of experiments (different tethered beads, i.e., different anchoring distances 2e). nS is proportional to F and increases as e decreases. Red (⋄), e = 1.1 μm; blue (○), e = 0.8 μm. (e) The relative extension at arrest z(nS)/zmax varies little with F or e. Its averaged value is: z(nS)/zmax = 0.65 ± 0.02, which is about the same as the value where the braids supercoil.
Fig. 5.
Fig. 5.
Step-by-step decatenation by Topo IV. (a and b) Filtered (1-Hz) time traces of relaxation of L- (a) and R-braids (b) by Topo IV obtained at low ATP concentration (5 μM) in the regime of supercoiled braids (z/zmax < zb/zmax ∼ 0.64) at F = 0.9 pN. The real-time extension z(t) is normalized by the measured decrease in extension per turn: δz ≈ 42 nm (Fig. 2). The slow relaxation of braided supercoils results in a large increase in the low-frequency fluctuations of extension that hinder the observation of well defined decatenation steps at integer values of z(t)/δz (dashed lines). However, the histogram of the normalized distance between two points (|z(t) – z(t′)|/δz) displays peaks at integer values (Insets), implying that decatenation occurs by steps of Δn =–1. (c) Proposed model for the relaxation of R-braids supercoils by Topo IV: two enzymatic reactions are needed to transfer one braid through one DNA and thereby decrease the catenation number by one (Δn = –1). Thermal fluctuations then drive the relaxation of the loop to an extended topoisomer. The rate of supercoiled R-braid unlinking is thus expected to be half the rate of L-braid unlinking (see Fig. 4b).
Fig. 6.
Fig. 6.
Configurations of a circular replicating DNA. (a) Model for in vivo strand separation: the progression of the replication complex leads to the formation of (+) supercoils (L-nodes) in front of the replication fork and R-precatenanes behind. Topo IV removes (+) supercoils and gyrase generates (–) supercoils so that, under the action of both enzymes, the chirality of the precatenanes is inverted (25). Topo IV may then unlink the molecules by removing the L-catenanes. (b) Model for in vitro decatenation by Topo IV: R-catenated plasmids may form L-supercoils that are removed by Topo IV with a high rate [as observed in our experiments and some bulk assays (21)]. However, the removal of the last few links is slow (11, 22), because Topo IV will relax only a rare fluctuation of an R-node to an obtuse angle that is similar to its preferred substrate: an L-node with acute angle (see Fig. 1b).

Similar articles

Cited by

References

    1. Wang, J. (1998) Q. Rev. Biophys. 31, 107–144. - PubMed
    1. Wang, J. (2002) Nat. Rev. Mol. Cell Biol. 3, 430–440. - PubMed
    1. Liu, L., Liu, C. & Alberts, B. (1980) Cell 19, 697–707. - PubMed
    1. Roca, J. & Wang, J. (1992) Cell 71, 833–840. - PubMed
    1. Roca, J. & Wang, J. (1996) Genes Cells 1, 17–27. - PubMed

Publication types

LinkOut - more resources