Clinical Trial
. 2003 Aug 6;23(18):6982-92.
doi: 10.1523/JNEUROSCI.23-18-06982.2003.

Multisensory integration during motor planning

Affiliations
Clinical Trial

Multisensory integration during motor planning

Samuel J Sober et al. J Neurosci. .

Abstract

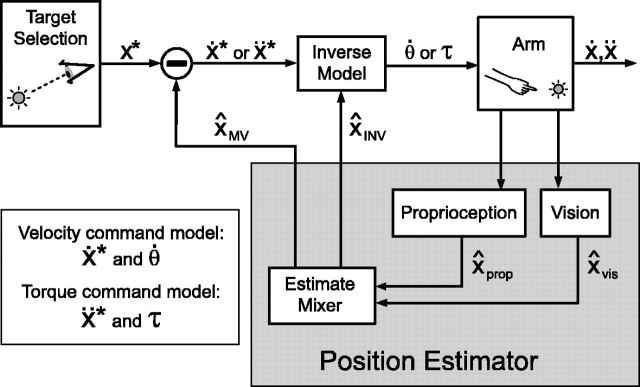
When planning goal-directed reaches, subjects must estimate the position of the arm by integrating visual and proprioceptive signals from the sensory periphery. These integrated position estimates are required at two stages of motor planning: first to determine the desired movement vector, and second to transform the movement vector into a joint-based motor command. We quantified the contributions of each sensory modality to the position estimate formed at each planning stage. Subjects made reaches in a virtual reality environment in which vision and proprioception were dissociated by shifting the location of visual feedback. The relative weighting of vision and proprioception at each stage was then determined using computational models of feedforward motor control. We found that the position estimate used for movement vector planning relies mostly on visual input, whereas the estimate used to compute the joint-based motor command relies more on proprioceptive signals. This suggests that when estimating the position of the arm, the brain selects different combinations of sensory input based on the computation in which the resulting estimate will be used.


Figures

Figure 1.
Figure 1.
Misestimation of arm position results in two types of reach errors. A, Errors resulting from a leftward shift in the position estimate used to plan the movement vector. The planned movement directions (gray arrows) differ from the actual hand-to-target directions (dashed lines). The pattern of directional errors (colored arrows) is plotted as a function of target direction in B. A rightward shift would produce the opposite pattern (see Fig. 4 B). CW, Clockwise; CCW, counterclockwise. C, Errors resulting from a leftward shift in the position estimate used to transform the desired movement vector into a joint-based motor command. The directions of the achieved movements (black arrows) differ from the planned movement directions (gray arrows). The pattern of errors (colored arrows) is plotted as a function of planned movement direction in D. The leftward shift shown here produces CW errors for all planned reach directions. A rightward shift would produce CCW errors.
Figure 2.
Figure 2.
Data collection and experimental design. A, Side view of the behavioral apparatus. For clarity, the tactile start points (dowels) and drape are not shown. B, Top view of a subject showing the placement of the infrared markers (gray dots). Joint angles (θ1 and θ2) were computed from these five positions and from the measured lengths of the upper and lower arm (L1 and L2). C, Workspace configuration. The dowels marking the three tactile start points (gray dots) were arranged in a line parallel to the subject's left-right axis and were spaced 6 cm apart. L, Leftstart point; C, center start point; R, rightstart point. D, Trial types. Grid entries indicate the tactile start point (left column) and the presence of a leftward or rightward shift (right column) in each trial type.
Figure 3.
Figure 3.
Two models of feedforward motor planning. Arm position estimates INV are computed by combining visual and proprioceptive signals. A movement vector describing the desired direction of the initial velocity (Ẋ*) or acceleration (ẍ*) of the hand is computed by subtracting MV from the target location x*. An inverse model transforms this desired extrinsic vector into an intrinsic motor command specifying joint angle velocities ( formula image) or torques (τ), depending on the model being implemented. This transformation makes use of a second position estimate, and INV. Finally, the motor command is executed, determining the initial hand trajectory. Note that the loop through the “Vision” and “Proprioception” boxes does not imply feedback control; in these models, the position estimates are only used to plan the plan the initial, feedforward component of a movement.
Figure 4.
Figure 4.
Shift-induced errors in initial reach direction predicted by the velocity command model with various values of αMV and αINV. Each plot shows the predicted errors in initial velocity direction as a function of target direction. Left column,αMV = 0; right column,αMV = 0.7; top row, αINV = 0; bottom row, αINV = 0.7. Black lines, Leftward shift; gray lines, rightward shift. Positive values on the ordinate correspond to CCW errors. Note that B shows the effects of MV error alone, C shows the effects of INV error alone, and D shows their combined effects when both MV and INV are shifted.
Figure 5.
Figure 5.
Data and velocity-command model fit from subject HA. Movement paths from all Center-Left (A), Center-Zero (B), and Center-Right (C) trials. D, Initial velocity direction (with respect to target direction) as a function of target direction for Center-Left (•, individual trials; solid black line, mean), Center-Zero (▪, dotted line), and Center-Right ( formula image
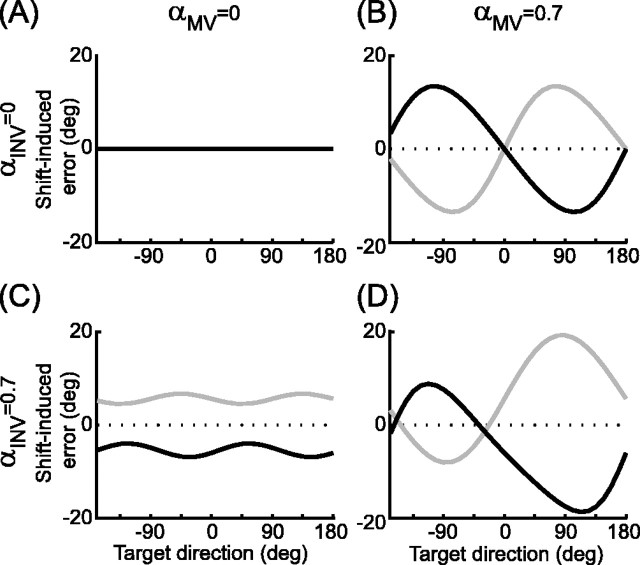
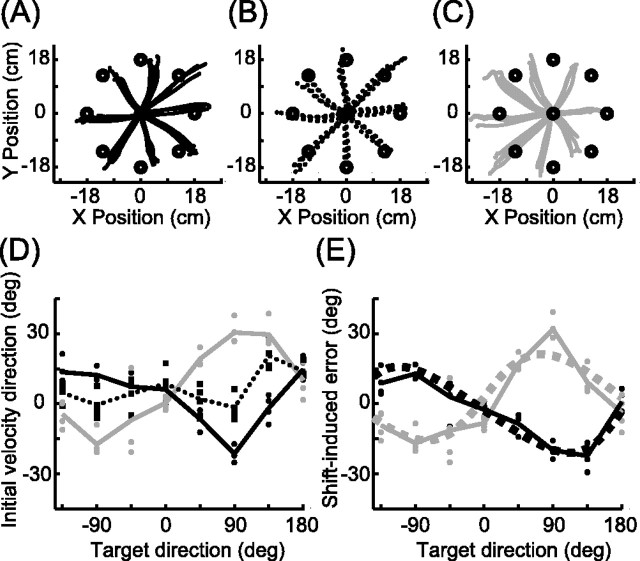
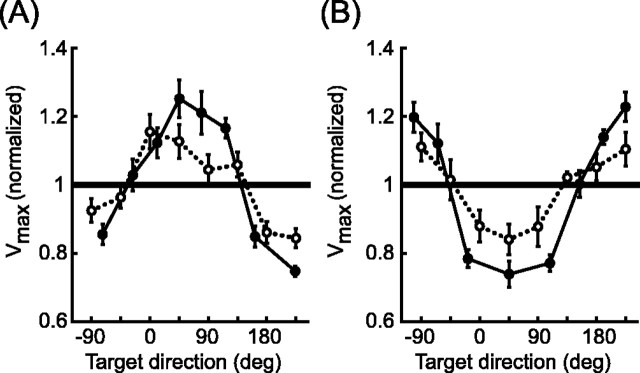
, gray line) trials. E, Shift-induced error as function of target direction. Dashed lines represent the errors predicted by the best-fit velocity-command model (αMV = 0.97, αINV = 0.34). Other symbols as in D.
Figure 6.
Figure 6.
Initial velocity data averaged across all subjects. A, Initial velocity direction (with respect to target direction) for Center-Left (solid black line), Center-Zero (dotted line), and Center-Right (gray line) trials. B, Shift-induced errors in initial velocity direction (line colors as in A). C, Initial velocity direction (with respect to target direction) for Left-Zero (solid black line), Center-Zero (dotted line), and Right-Zero (gray line) trials. D, Data from C after subtraction of the mean Center-Zero directions. Line colors as in C. Target directions in C and D are relative to the center start point for ease of comparison. Error bars in all plots are ± 1 SE. Dashed lines in B and D indicate means for a given dataset.
Figure 7.
Figure 7.
Best-fit values of αMV and αINV for all subjects and both models. Each symbol is divided into quadrants that are filled or empty depending on the results of the specified hypothesis tests (p < 0.05; see inset). Ellipses represent 1 SE (bootstrap analysis; see Materials and Methods). Two-letter labels identify individual subjects. The dashed line represents αINV = αMV.
Figure 8.
Figure 8.
Initial reach segments and predicted INV error. The initial portion of reaches (un-filtered empirical data) are shown for all trials from subject HA in the Center-Left (A) and Center-Right (B) conditions. Black lines represent the path from movement onset to the point at which the tangential velocity first exceeds 40% of the peak velocity (black dots). The large circle (dashed line) represents the center start point window (radius 1 cm). Gray contour lines show the magnitude of the predicted INV errors (velocity command model) caused by the distortion matrix formula image as a function of arm position, assuming αINV = 1. Positive contour values correspond to CCW errors; negative values signify CW errors.
Figure 9.
Figure 9.
Effects of visual shifts on reach velocity magnitude. Each line plots the mean peak tangential velocity (across subjects) for each target normalized to the mean peak tangential velocity in Center-Zero trials. Target directions are defined as the direction from the fingertip start position to the visual target. A, Left-Zero (solid line) and Center-Left (dotted line) trials. B, Right-Zero (solid line) and Center-Right (dotted line) trials. Error bars are ± 1 SE.

References

    1. Aglioti S, DeSouza JFX, Goodale MA ( 1995) Size-contrast illusions deceive the eye but not the hand. Curr Biol 5: 679-685. - PubMed
    1. Andersen RA, Snyder LH, Bradley DC, Xing J ( 1997) Multimodal representation of space in the posterior parietal cortex and its use in planning movements. Ann Rev Neurosci 20: 303-330. - PubMed
    1. Atkeson CG, Hollerbach JM ( 1985) Kinematic features of unrestrained vertical arm movements. J Neurosci 5: 2318-2330. - PMC - PubMed
    1. Buneo CA, Jarvis MR, Batista AP, Andersen RA ( 2002) Direct visuomotor transformations for reaching. Nature 416: 632-636. - PubMed
    1. Cheney PD, Fetz EE ( 1980) Functional classes of primate corticomotoneuronal cells and their relation to active force. J Neurophysiol 44: 773-791. - PubMed

Publication types