. 2003 Aug 6;23(18):7012-20.
doi: 10.1523/JNEUROSCI.23-18-07012.2003.

Patterned vision causes CRE-mediated gene expression in the visual cortex through PKA and ERK

Affiliations

Patterned vision causes CRE-mediated gene expression in the visual cortex through PKA and ERK

Laura Cancedda et al. J Neurosci. .

Abstract

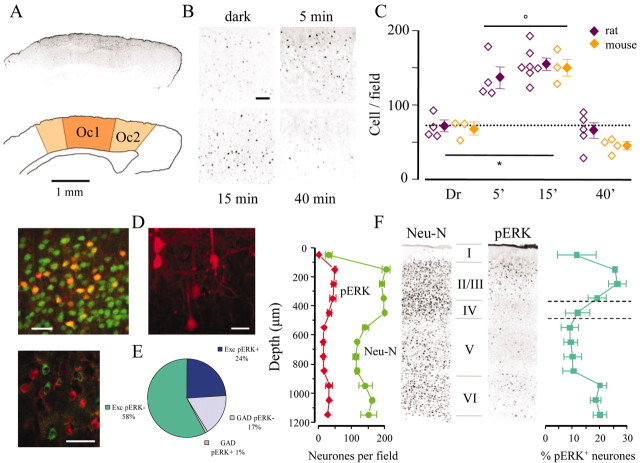
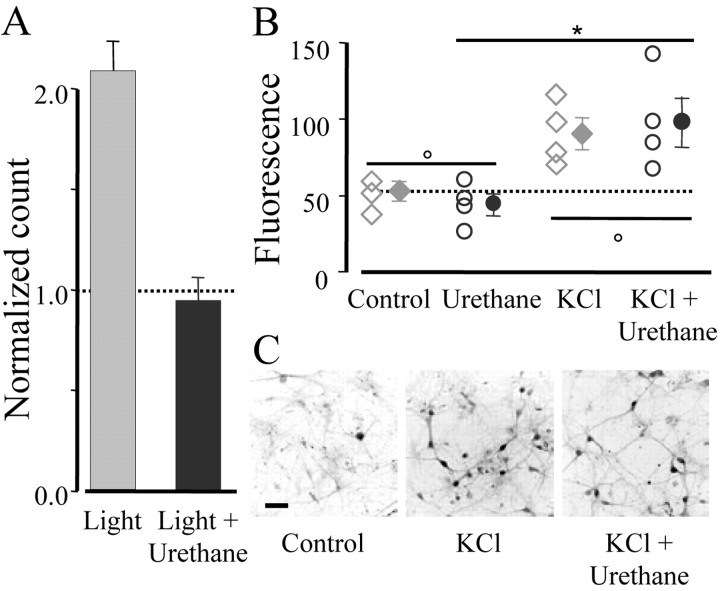
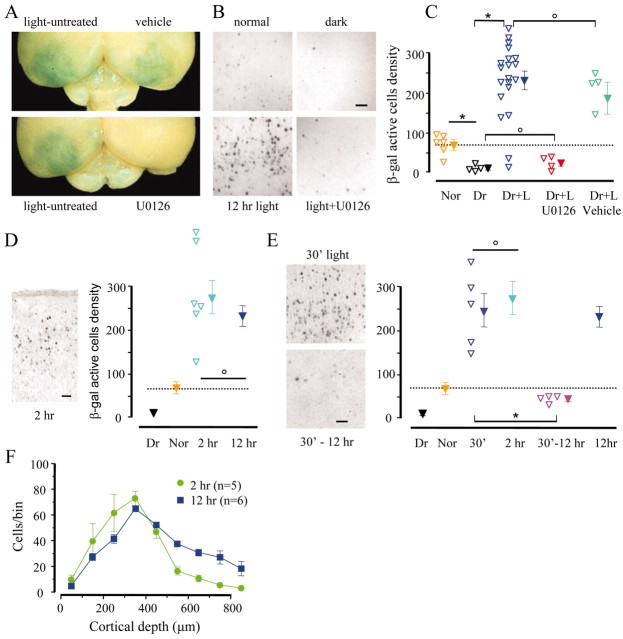
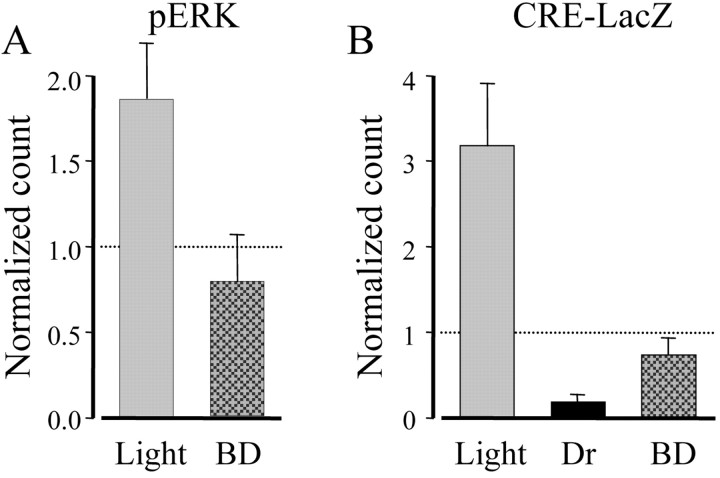
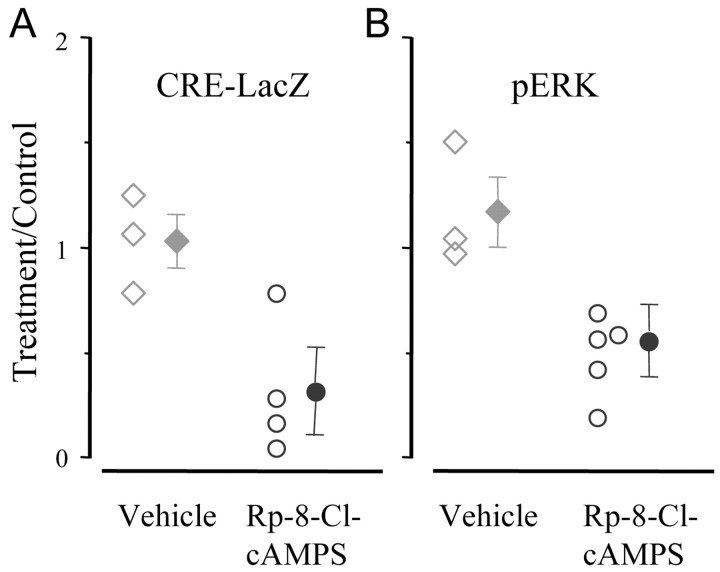
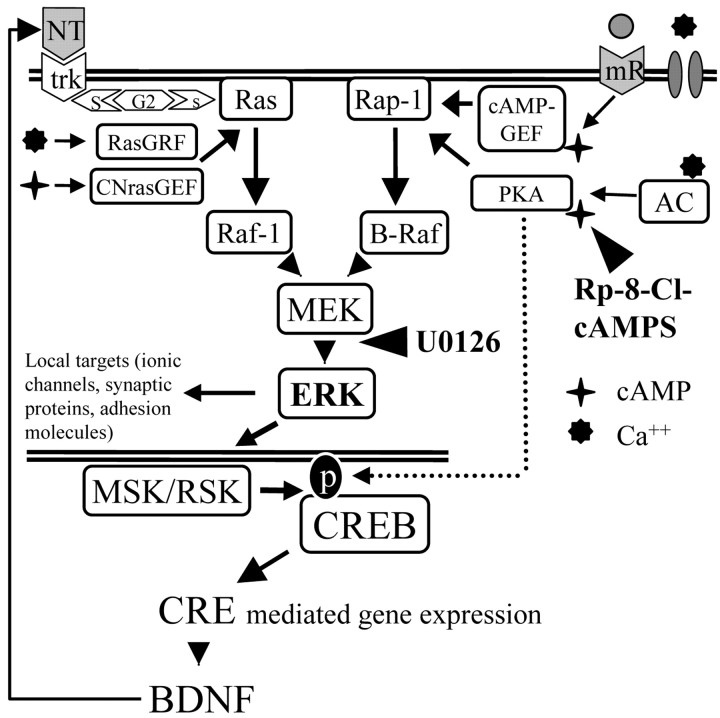
Normal visual experience during postnatal development is necessary for the maturation of visual cortical circuits and acts through molecular mechanisms that are still poorly understood. Recently, it has been shown that ERK (extracellular signal-regulated kinase) 1/2, protein kinase A (PKA), and CREB (cAMP response element-binding protein) are crucial factors for experience-dependent development of the visual cortex, but very little is known about the role of visual experience in their activation. Here, we show that visual stimulation after a brief period of dark rearing caused a transient ERK activation in the visual cortex. Visually induced ERK activation occurred primarily in excitatory neurons of layers II-III and VI and was prevented by binocular lid suture. ERK phosphorylation was strongly reduced by cortical infusion with the cAMP-PKA inhibitor Rp-8-Cl-cAMPS, thus establishing a link between PKA and ERK activation. To analyze the downstream consequences of ERK and PKA signaling, we studied the action of visual stimulation on transcription of genes controlled by CREB in transgenic mice carrying the LacZ reporter gene under the control of the CRE (cAMP response element) promoter. Visual stimulation triggered a prolonged episode of CRE-mediated gene expression in the visual cortex that was suppressed by infusion with the ERK inhibitor U0126. Cortical administration of Rp-8-Cl-cAMPS attenuated the experience-dependent activation of CRE-mediated gene transcription. These results show that ERK phosphorylation in visual cortical neurons represents a molecular readout of patterned visual stimuli and that visual activation of ERK involves the cAMP-PKA system. Finally, because CRE-mediated gene expression was totally dependent on ERK activation, we suggest that PKA action on CRE-mediated gene expression is mediated by ERK.


Figures

Figure 1.
Figure 1.
Visual experience induced ERK phosphorylation in the visual cortex after a 3 d period of obscurity during the critical period. A, pERK immunofluorescence of a transverse section of a mouse brain approximately -3 mm from bregma, 15 min after return to light. Positive cells were concentrated in the primary (Oc1) and secondary (Oc2) visual cortices. B, Fields of layers II-III in rats exposed to light for the specified time. C, pERK-positive cells were counted in fields (0.49 mm2) centered on the binocular cortex. Open symbols show the average count for each animal and the average ± SEM for each experimental group. Two-way ANOVA showed no effect of the species (p = 0.234) and a significant effect of the time (p < 0.001). The density of pERK-positive cells was significantly different from Dr at 5 and 15 min (p < 0.05) but not at 40 min (p > 0.05; Tukey tests). The horizontal bar with an asterisk indicates that the groups are statistically different, and the open circle indicates statistical identity. D, Left, Double immunostaining for pERK (red) and the neuronal marker NeuN (green). In layers II-III, 25% of the neuronal population was pERK positive after 15 min of visual activity. Right, pERK-positive neurons had a characteristic pyramidal morphology. E, Immunostaining for pERK and GAD67 (green) shows that the vast majority of pERK-positive neurons was excitatory, as quantified in the pie diagram (three animals). F, Double immunostaining for NeuN and pERK shows that pERK-positive neurons were distributed primarily in the superficial layers of the cortex. Counting has been performed on a single optical section at the confocal microscope, dividing the cortex in bins of 100 μm thick. Averages of counting on two slices were obtained from three separate rats. Identical results have been obtained in mice. Scale bars: A, 1 mm; B, 100 μm; D, 20 μm; E, 40 μm.
Figure 2.
Figure 2.
ERK phosphorylation induced by visual activity required wakefulness. A, Fifteen rats were kept in darkness for 3 d and then nine animals received an intraperitoneal injection of urethane (n = 5) or saline before being returned to light for 15 min. The remaining six rats were kept in darkness and acted as controls. Anesthetized animals had a level of pERK phosphorylation comparable with the Dr controls (dotted line), whereas saline-injected animals had normal activation (one-way ANOVA; p < 0.01; post hoc Tukey test; light plus urethane vs Dr, p > 0.05, and vs light, p < 0.05). B, An anesthetic concentration of urethane did not directly inhibit ERK phosphorylation. Cultured neurons from the visual cortex were processed for pERK immunostaining after a pulse of 90 mm KCl in the presence of 10 mm urethane and under control conditions. Each symbol represents the average counting obtained from several fields acquired on each coverslip, and filled symbols indicate mean ± SEM. One-way ANOVA (p < 0.05) followed by post hoc Student-Newman-Keuls test shows that KCl and KCl plus urethane did not differ between each other (p > 0.05) and were statistically different from saline or urethane (p < 0.05). Urethane, per se, did not affect pERK levels (p > 0.05). C, Fields showing pERK immunostaining in the indicated conditions. Scale bar, 50 μm.
Figure 3.
Figure 3.
Visual experience after a 3 d period of darkness caused CRE-mediated gene expression to be dependent on ERK activation. A, Brains that reacted for X-gal histochemistry show that the visual cortex was densely populated with positive neurons. Treatment with the ERK kinase inhibitor U0126 completely suppressed CRE-mediated gene expression in the treated but not in the control hemisphere. B, Fields from superficial layers of the visual cortex in the indicated conditions. C, Quantification of the density of positive cells (1 mm2 fields). Dr has significantly less positive cells than mice kept in a normal visual environment (Nor) (t test; p < 0.01). Exposure to light significantly increased the number of positive cells, an effect completely prevented by U0126 but not by its vehicle (one-way ANOVA; p < 0.01; post hoc Tukey test; p < 0.05). The Dr plus light (Dr+L) group was composed of eight mice plus an additional 12 cortices from the control side of the minipump experiments. D, Two and 12 hr of visual experience equally activated CRE-mediated gene expression (one-way ANOVA; p < 0.01; post hoc Tukey test; p < 0.01). E, Thirty minutes of visual experience followed by 90 min of darkness was sufficient to trigger CRE-mediated gene expression to a level not significantly different from visual stimulation for the same period of time (t test; p = 0.64). Gene expression was not maintained in the absence of visual experience, because if the 30 min stimulation was followed by 11.5 hr of darkness, the number of X-gal-positive cells was strongly decreased (t test; p < 0.01). F, Distribution of X-gal-positive cells throughout the cortical depth. Scale bars, 50 μm. Asterisks and circles indicate groups that are statistically different or identical, respectively. Open symbols indicate data from a single animal; filled symbols are the averages.
Figure 4.
Figure 4.
Pattern vision was required for ERK phosphorylation and CRE-mediated gene expression. A, Three rats in the critical period were deprived of pattern vision by binocular deprivation (BD). After 3 d in darkness, they were returned to light for 15 min. Two additional rats were returned to light with open eyelids, and four rats remained in darkness and acted as controls. PERK-positive cell counting is expressed as a fraction of control. BD completely suppressed pERK activation after returning to light (Kruskal-Wallis one-way ANOVA on ranks, p = 0.004; post hoc Dunn's method BD vs light, p < 0.05, and vs Dr, p > 0.05). B, A similar protocol of BD and dark rearing was applied to the CRE-LacZ mice (see Table 1). Cell densities are shown normalized to the density of control mice that were kept in a normal light/dark cycle. BD drastically reduced the gene expression 12 hr after returning to light (one-way ANOVA, p < 0.001; post hoc Tukey test, BD vs light, p < 0.05, vs Dr and norm, p > 0.05).
Figure 5.
Figure 5.
Inhibition of cAMP signaling reduced visually driven CRE-mediated gene expression and ERK phosphorylation. A, CRE-LacZ mice were implanted with osmotic minipumps that delivered either vehicle or Rp-8-Cl-cAMPS to the visual cortex. After 3 d in darkness, the animals were returned to light for 12 hr before being killed and histochemistry. The density of X-gal-positive cells in Rp-8-Cl-cAMPS-treated cortices was reduced with respect to the untreated cortex of the same animal (paired t test; p < 0.05) but was increased with respect to Dr (t test; p < 0.05). Vehicle treatment was ineffective (paired t test; p > 0.05). B, Ratio of pERK-positive cells in the treated vs untreated cortex of eight rats implanted with osmotic minipumps as above. After 3 d in darkness, the animals were returned to light for 15 min before being killed. The density of pERK-positive neurons was clearly reduced by the infusion of Rp-8-Cl-cAMPS (paired t test; untreated cortex vs treated cortex of the same animal; p < 0.05), although it was increased with respect to Dr rats (t test; p < 0.05). The treatment with vehicle did not affect ERK activation (paired t test; p > 0.05). Open symbols indicate data from each animal; filled symbols are the group averages.
Figure 6.
Figure 6.
ERK pathway in the visual cortex. Neurotrophins and electrical activity modulate ERK through two separate pathways that converge on the ERK kinase MEK. The neurotrophin signal is conveyed from the tyrosine kinase receptors (trk) to Ras by the Shc-Grb2-sos intermediates (S-G2-s), leading to activation of ERK and CREB (Ginty et al., 1994; Pizzorusso et al., 2000). Electrical activity is translated in two different intracellular signals: (1) an increase of Ca2+ caused by influx through voltage-gated channels and NMDA receptors, and (2) an increase of cAMP attributable to activation of metabotropic receptors (mR) or by Ca-dependent adenylate cyclase (AD). The cAMP-dependent activation of ERK is mediated by cAMP-GEF and CNrasGEF, whereas the direct Ca-dependent activation of ERK is primarily mediated by the Ca-dependent regulating factor RasGRF. The CRE promoter controls the expression of a large number of genes including BDNF (West et al., 2001). NT, Neurotrophins; AC, adenylate cyclase.

References

    1. Azouz R, Gray CM, Nowak LG, McCormick DA ( 1997) Physiological properties of inhibitory interneurons in cat striate cortex. Cereb Cortex 7: 534-545. - PubMed
    1. Bading H, Greenberg ME ( 1991) Stimulation of protein tyrosine phosphorylation by NMDA receptor activation. Science 253: 912-914. - PubMed
    1. Barth AL, McKenna M, Glazewski S, Hill P, Impey S, Storm D, Fox K ( 2000) Upregulation of cAMP response element-mediated gene expression during experience-dependent plasticity in adult neocortex. J Neurosci 20: 4206-4216. - PMC - PubMed
    1. Beaver CJ, Ji Q, Fischer QS, Daw NW ( 2001) Cyclic AMP-dependent protein kinase mediates ocular dominance shifts in cat visual cortex. Nat Neurosci 4: 159-163. - PubMed
    1. Berkeley JL, Decker MJ, Levey AI ( 2002) The role of muscarinic acetylcholine receptor-mediated activation of extracellular signal-regulated kinase 1/2 in pilocarpine-induced seizures. J Neurochem 82: 192-201. - PubMed

Publication types

MeSH terms

Substances

LinkOut - more resources