. 2003 Aug 6;23(18):7160-8.
doi: 10.1523/JNEUROSCI.23-18-07160.2003.

The statistical structure of human speech sounds predicts musical universals

Affiliations

The statistical structure of human speech sounds predicts musical universals

David A Schwartz et al. J Neurosci. .

Abstract

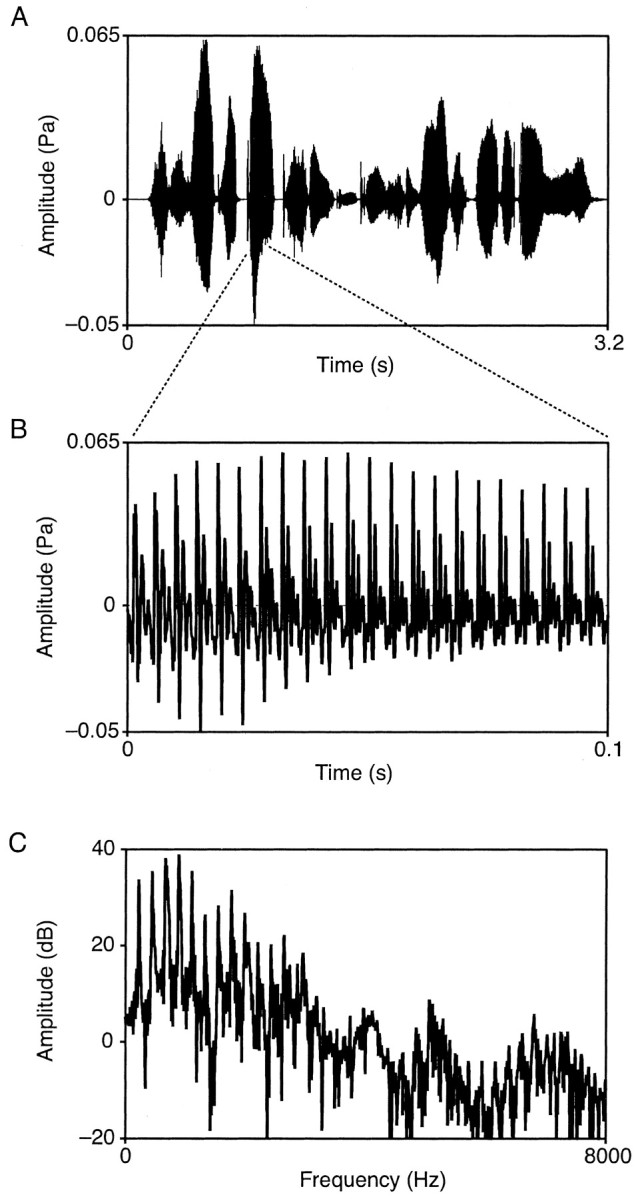
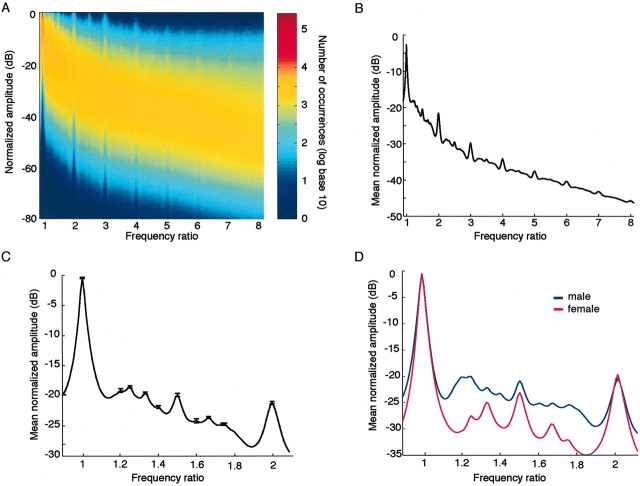
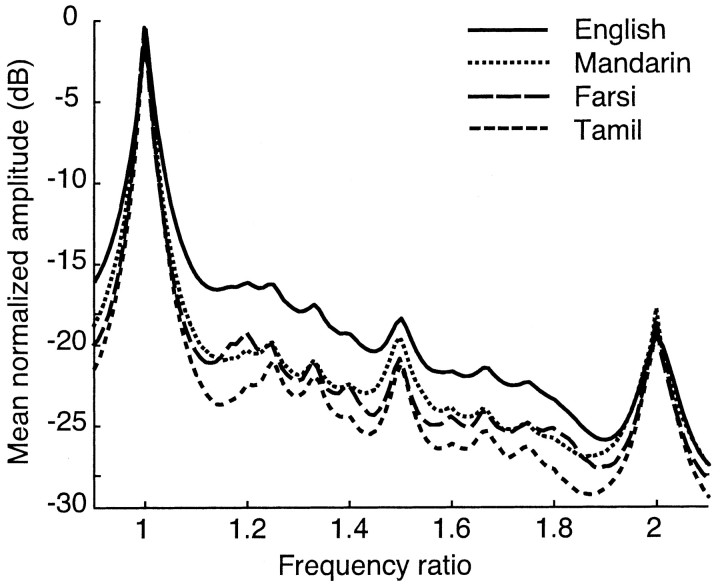
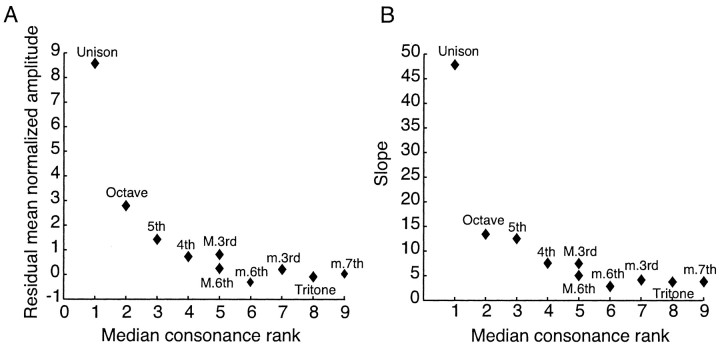
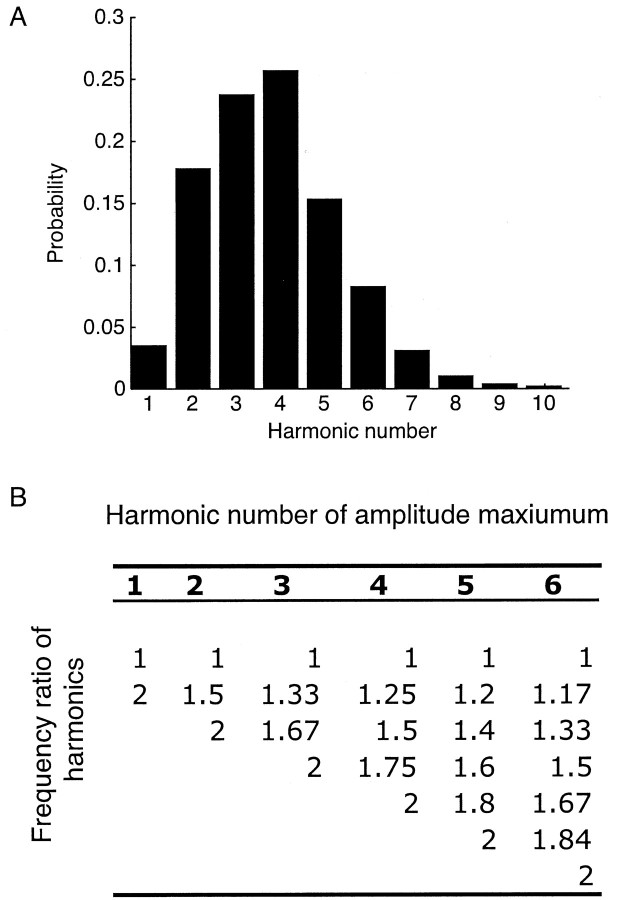
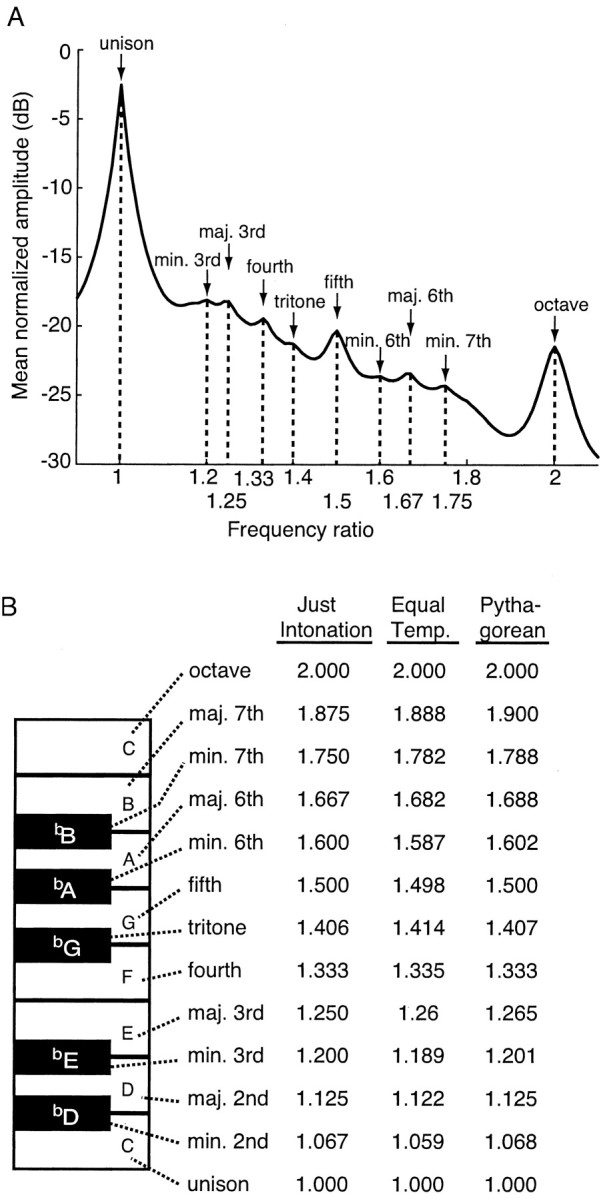
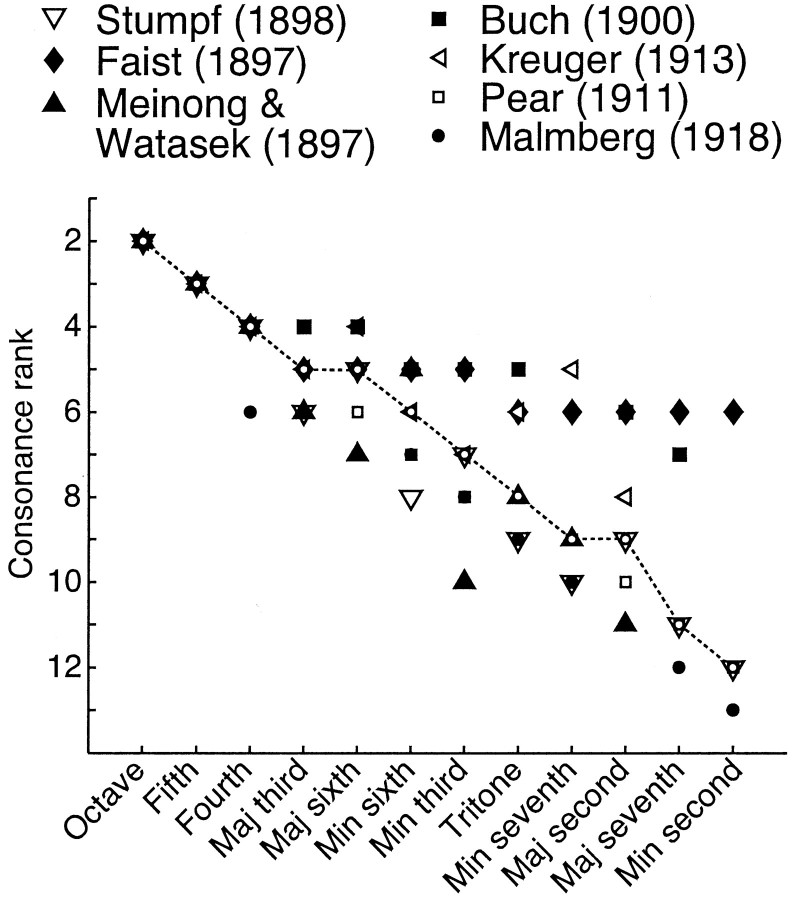
The similarity of musical scales and consonance judgments across human populations has no generally accepted explanation. Here we present evidence that these aspects of auditory perception arise from the statistical structure of naturally occurring periodic sound stimuli. An analysis of speech sounds, the principal source of periodic sound stimuli in the human acoustical environment, shows that the probability distribution of amplitude-frequency combinations in human utterances predicts both the structure of the chromatic scale and consonance ordering. These observations suggest that what we hear is determined by the statistical relationship between acoustical stimuli and their naturally occurring sources, rather than by the physical parameters of the stimulus per se.


Figures

Figure 1.
Figure 1.
Analysis of speech segments. A, Variation of sound pressure level over time for a representative utterance from the TIMIT corpus (the sentence in this example is “She had your dark suit in greasy wash water all year”). B, Blowup of a 0.1 sec segment extracted from the utterance(in this example the vowel sound in“dark”). C, The spectrum of the extracted segment in B, generated by application of a fast Fourier transform.
Figure 2.
Figure 2.
Statistical characteristics of spoken American English based on an analysis of the spectra extracted from the >100,000 segments (200 per speaker) in the TIMIT corpus. Mean normalized amplitude is plotted as a function of normalized frequency, the maxima indicating the normalized frequencies at which power tends to be concentrated. A, The normalized probability distribution of amplitude-frequency combinations for the frequency ratio range 1-8. B, Mean normalized amplitude plotted as a function of normalized frequency over the same range. C, Blowup of the plot in B for the octave interval bounded by the frequency ratios 1 and 2. Error bars show the 95% confidence interval of the mean at each local maximum. D, The plot in C shown separately for male (blue) and female (red) speakers.
Figure 4.
Figure 4.
Statistical structure of speech sounds in Farsi, Mandarin Chinese, and Tamil, plotted as in Figure 2 (American English is included for comparison). The functions differ somewhat in average amplitude, but are remarkably similar both in the frequency ratios at which amplitude peaks occur, and the relative heights of these peaks.
Figure 7.
Figure 7.
Consonance rankings predicted from the normalized spectrum of speech sounds. A, Median consonance rank of musical intervals (from Fig. 6) plotted against the residual mean normalized amplitude at different frequency ratios. B, Median consonance rank plotted against the average slope of each local maximum. By either index, consonance rank decreases progressively as the relative concentration of power at the corresponding maxima in the normalized speech sound spectrum decreases.
Figure 3.
Figure 3.
Probability distribution of the harmonic number at which the maximum amplitude occurs in speech sound spectra derived from the TIMIT corpus. A, The distribution for the first 10 harmonics of the fundamental frequency of each spectrum. More than 75% of the amplitude maxima occur at harmonic numbers 2-5. B, The frequency ratio values at which power concentrations are expected within the frequency ratio range 1-2 (Fig. 2C) when the maximum amplitude in the spectrum of a periodic signal occurs at different harmonic numbers. There are no peaks in Figure 2 at intervals corresponding to the reciprocals of integers >6, reflecting the paucity of amplitude maxima at harmonic numbers >6 (A). See Materials and Methods for further explanation.
Figure 5.
Figure 5.
Comparison of the normalized spectrum of human speech sounds and the intervals of the chromatic scale. A, The majority of the musical intervals of the chromatic scale (arrows) correspond to the mean amplitude peaks in the normalized spectrum of human speech sounds, shown here over a single octave (Fig. 2C). The names of the musical intervals and the frequency ratios corresponding to each peak are indicated. B, A portion of a piano keyboard indicating the chromatic scale tones over one octave, their names, and their frequency ratios with respect to the tonic in the three major tuning systems that have been used in Western music. The frequency ratios at the local maxima in A closely match the frequency ratios that define the chromatic scale intervals.
Figure 6.
Figure 6.
Consonance ranking of chromatic scale tone combinations (dyads) in the seven psychophysical studies reported by Malmberg (1918), Faist (1897), Meinong and Witasek (1897), Stumpf (1898), Buch (1900), Pear (1911), and Kreuger (1913). Graph shows the consonance rank assigned each of the 12 chromatic dyads in the various studies reported. The median values are indicated by open circles connected by a dashed line.

Similar articles

Cited by

References

    1. Balzano GJ ( 1980) The group-theoretic description of 12-fold and microtonal pitch systems. Comp Mus J 4: 66-84.
    1. Boersma P, Weenink D (2001) PRAAT 4.0.7: Doing phonetics by computer. (Department of Phonetic Sciences, University of Amsterdam). [There is no print version; download is available at http://fonsg3.let.uva.nl/praat/].
    1. Braun M ( 1999) Auditory midbrain laminar structure appears adapted to f0 extraction: further evidence and implications of the double critical bandwidth. Hear Res 129: 71-82. - PubMed
    1. Buch E ( 1900) Uber die Verschmelzungen von Empfindungen besonders bei klangeindrucken. Phil Stud 15: 240.
    1. Budge H ( 1943) A study of chord frequencies. New York: Bureau of Publications, Teachers College, Columbia University.

Publication types

LinkOut - more resources