. 2003 Aug 6;23(18):7194-206.
doi: 10.1523/JNEUROSCI.23-18-07194.2003.

Auditory cortical responses elicited in awake primates by random spectrum stimuli

Affiliations

Auditory cortical responses elicited in awake primates by random spectrum stimuli

Dennis L Barbour et al. J Neurosci. .

Abstract

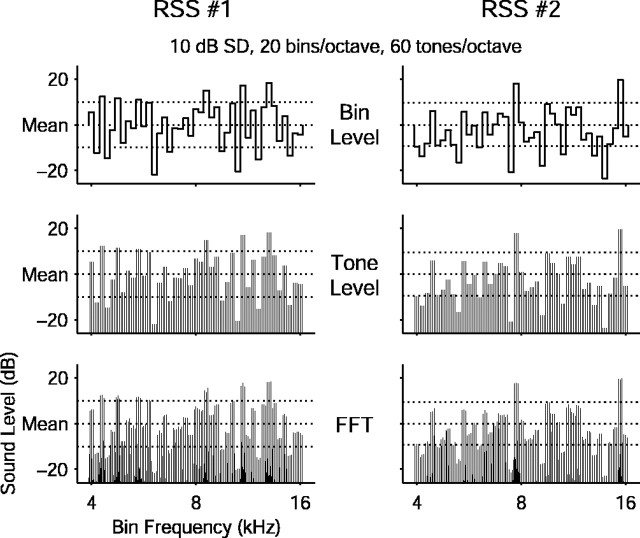
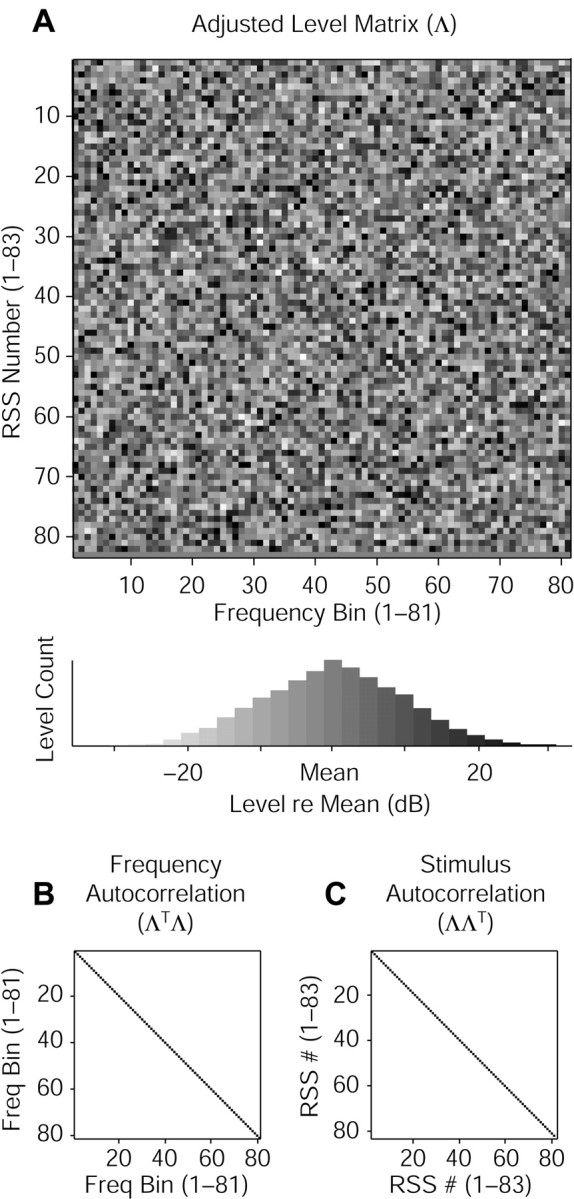
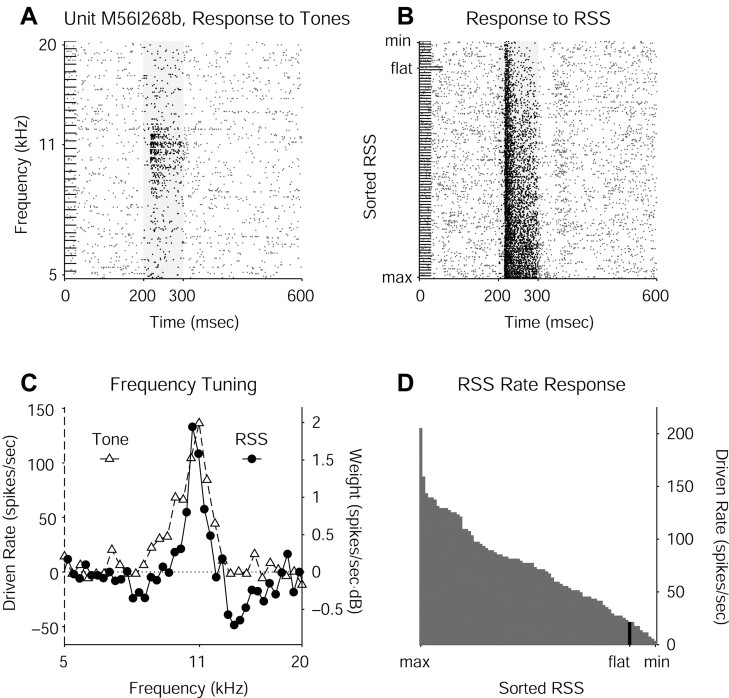
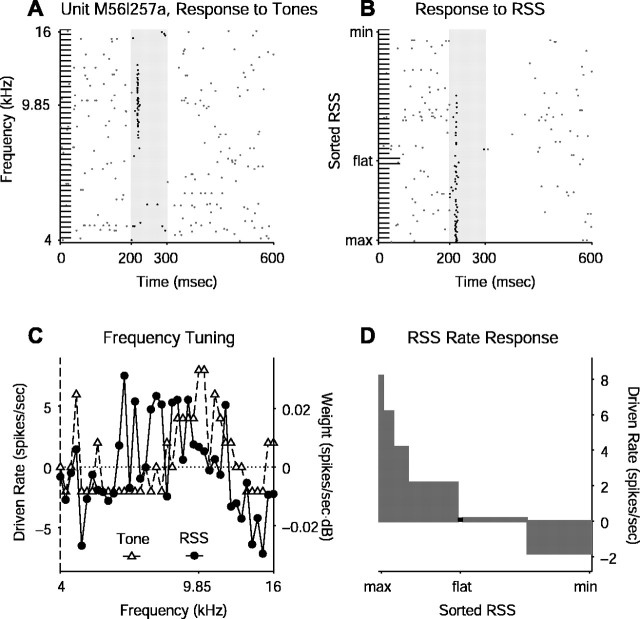
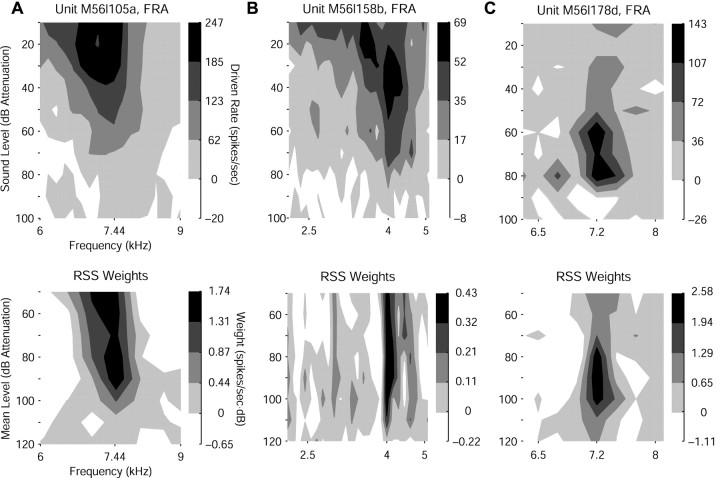
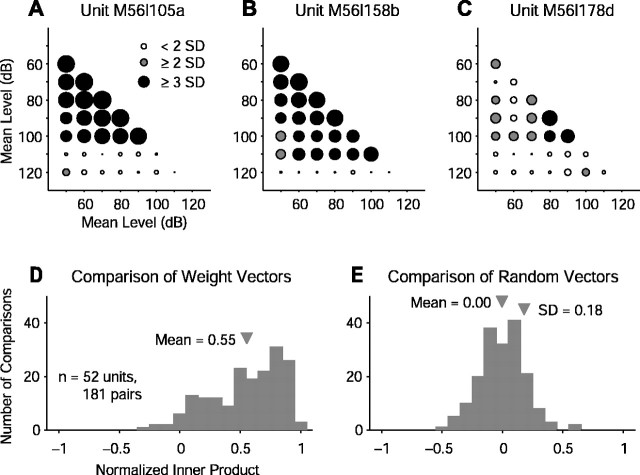
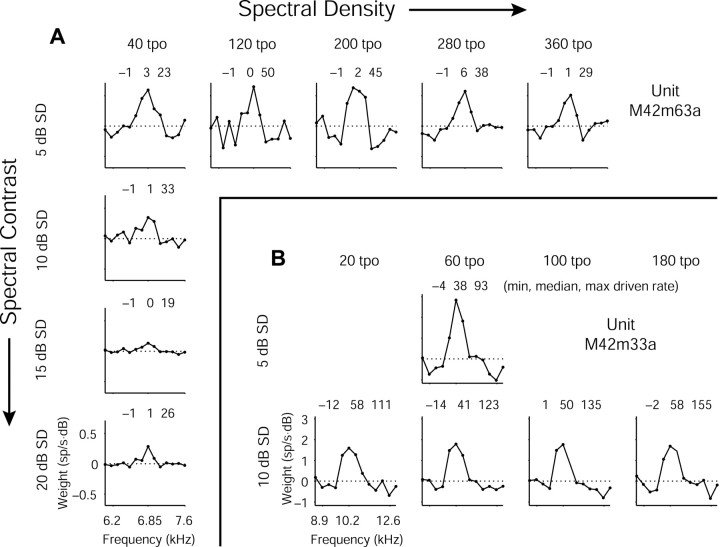
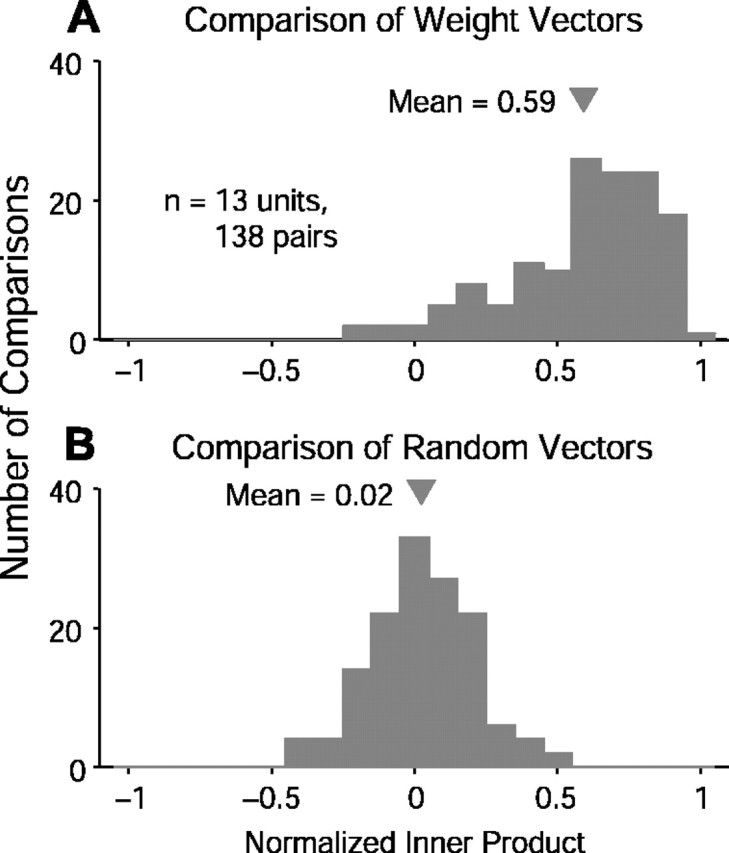
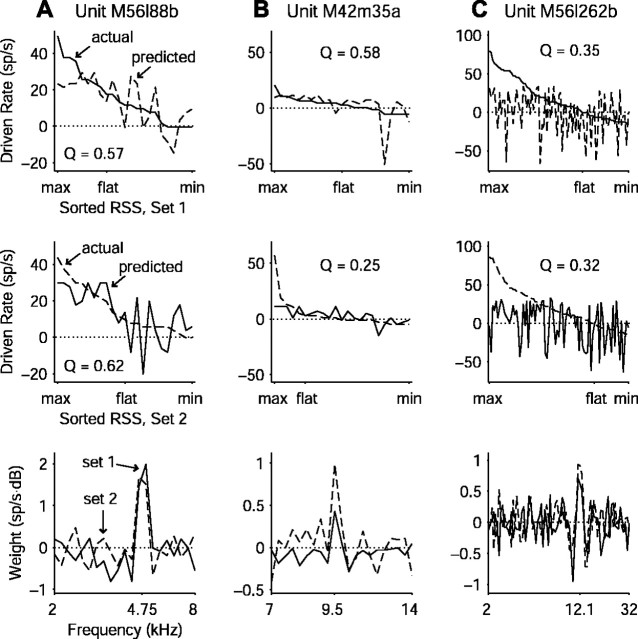
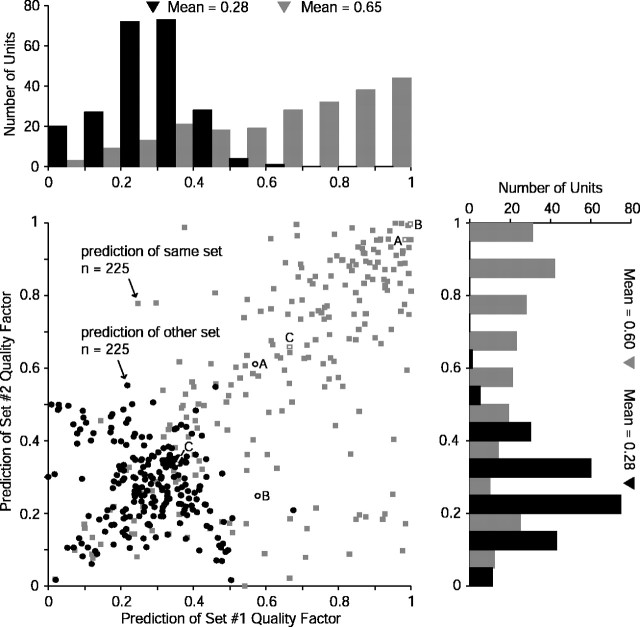
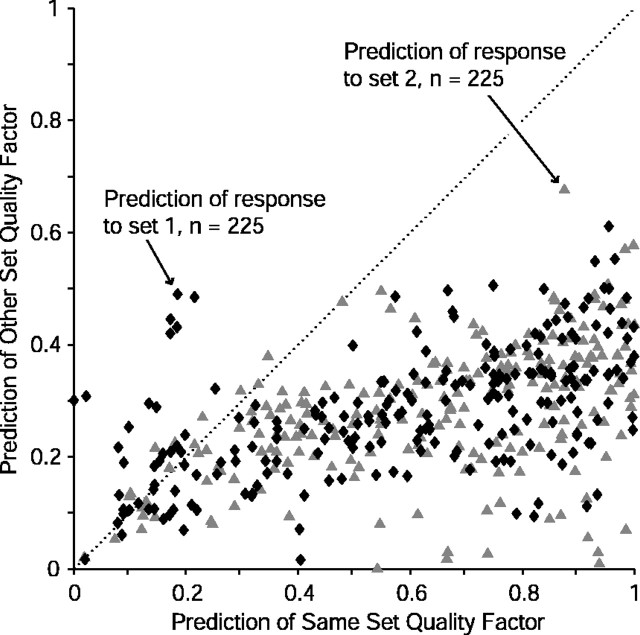
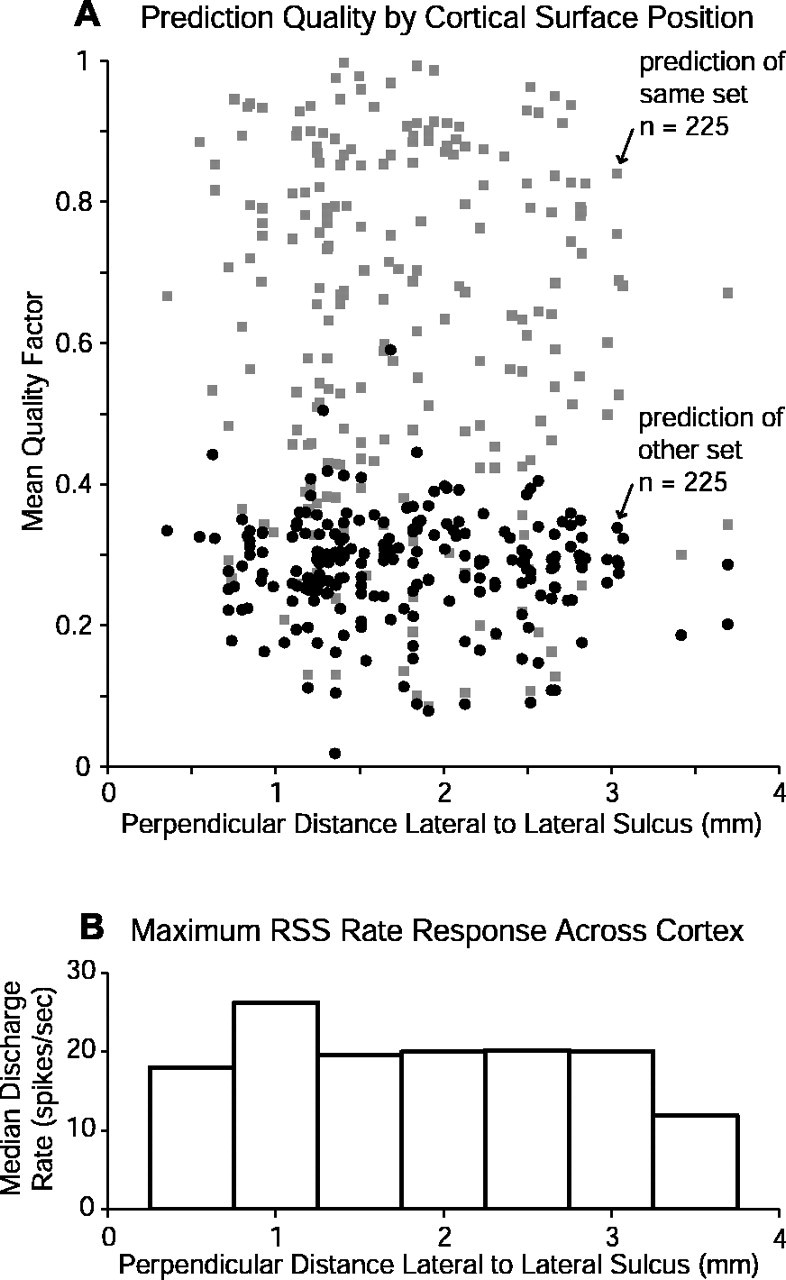
Contrary to findings in subcortical auditory nuclei, auditory cortex neurons have traditionally been described as spiking only at the onsets of simple sounds such as pure tones or bandpass noise and to acoustic transients in complex sounds. Furthermore, primary auditory cortex (A1) has traditionally been described as mostly tone responsive and the lateral belt area of primates as mostly noise responsive. The present study was designed to unify the study of these two cortical areas using random spectrum stimuli (RSS), a new class of parametric, wideband, stationary acoustic stimuli. We found that 60% of all neurons encountered in A1 and the lateral belt of awake marmoset monkeys (Callithrix jacchus) showed significant changes in firing rates in response to RSS. Of these, 89% showed sustained spiking in response to one or more individual RSS, a substantially greater percentage than would be expected from traditional studies, indicating that RSS are well suited for studying these two cortical areas. When firing rates elicited by RSS were used to construct linear estimates of frequency tuning for these sustained responders, the shape of the estimate function remained relatively constant throughout the stimulus interval and across the stimulus properties of mean sound level, spectral density, and spectral contrast. This finding indicates that frequency tuning computed from RSS reflects a robust estimate of the actual tuning of a neuron. Use of this estimate to predict rate responses to other RSS, however, yielded poor results, implying that auditory cortex neurons integrate information across frequency nonlinearly. No systematic difference in prediction quality between A1 and the lateral belt could be detected.


Figures

Figure 1.
Figure 1.
Example random spectrum stimuli (RSS) from the same set. Two RSS from the same stimulus set are shown plotted as bin levels (top), tone levels (middle), and amplitude spectra (bottom). The bins have a level SD of 10 dB over the entire set, indicated by horizontal dotted lines. All of the stimuli span two octaves of frequency from 4 to 16 kHz with 20 bins per octave. Each bin contains three logarithmically spaced tones of the same level for a density of 60 tones per octave. This set contained an additional 41 stimuli, including the stimulus with all bin levels at the mean value (i.e., the flat-spectrum stimulus).
Figure 2.
Figure 2.
Graphic depiction of RSS set properties. A, An adjusted level matrix (Λ) is shown in levels of gray. Individual stimuli are plotted in rows; frequency bins are plotted in columns. The matrix has 81 bins, each with a normal level distribution (histogram below) of 10 dB SD, and 83 stimuli, with the flat-spectrum stimulus represented in the bottom row. This matrix was used to create a stimulus four octaves wide (2-32 kHz) with 20 bins per octave, which was then used to characterize the unit shown in Figure 3. B, Autocorrelation of the adjusted level matrix columns (ΛTΛ) indicates an orthonormal column space. C, Autocorrelation of the rows (ΛΛT) indicates white (uncorrelated) stimuli.
Figure 3.
Figure 3.
Sustained response to RSS. A, Raster plot of responses of one unit to 100 msec pure tones at many different carrier frequencies delivered at a level of 70 dB attenuation. Shaded areas on all raster plots represent stimulus duration; dots represent action potential spikes. Rate analysis window corresponds to stimulus duration. B, Raster plot of sorted responses to one set of RSS delivered at a mean level of 80 dB attenuation. Response to flat-spectrum stimulus is indicated. C, FRF from tones overlaid with RSS WF reconstructed as a weighted average of the stimuli from B, showing similarity of CF estimated from both methods. All rate plots show driven rate (discharge rate - spontaneous rate). D, Sorted RSS driven rates computed from the raster plot in B.
Figure 4.
Figure 4.
Onset-only response to RSS. Format is identical to that of Figure 3. A, Raster plot of responses to 100 msec pure tones at 40 dB attenuation. This unit responds at stimulus onset only, if at all, to all types of stationary stimuli tested. B, Raster plot of sorted responses to one RSS set at 70 dB attenuation. C, Tone FRF overlaid with RSS WF, which is noisy. D, Sorted driven rates computed from the raster plot in B.
Figure 5.
Figure 5.
WF comparison over entire stimulus duration. A, WFs computed from spikes throughout the stimulus interval were compared using normalized inner products to WFs similarly computed but using only spikes from each quintile of the stimulus duration. Sustained responders show similarity of WFs throughout the stimulus interval (shading) and a decline of similarity throughout a similar interval after stimulus offset, both for stimuli of 100 msec duration (dashed line) and longer (dotted line). B, Onset-only responders exhibit a rapid decline in WF similarity during the stimulus interval and chance levels (0) after stimulus offset.
Figure 6.
Figure 6.
Examples of WF similarity across mean level. A, Tone FRA of a unit with monotonic level response (top panel) and RSS WFs computed at various mean sound levels (bottom panel). FRA tends to show a spread of excitation at more intense sounds, whereas WFs show little tendency to do so. Shading represents quartiles of rate/weight response from 0 to the maximum; inhibitory areas are white. B, FRA and WFs of a unit with a nonmonotonic level response. Tones reveal spread of excitation at high intensity not evident in RSS. C, FRA and WFs of a unit with a highly nonmonotonic level response showing a limited dynamic range of excitability.
Figure 7.
Figure 7.
Quantification of WF similarity across mean level. A-C, Pairwise normalized inner product matrices for the WFs shown in Figure 6. For each unit, the normalized distances between pairs of weighting vectors at different mean levels reveal similarity in RSS-derived tuning within the dynamic range of the unit. Normalized inner products are mapped to circle size with shading marking multiples of control distribution SD: 0.18. These matrices are symmetric with diagonals of 1, and only the lower diagonal portions are shown. D, Distribution of all pairwise comparisons for all 52 units studied at different mean RSS levels. Dissimilarity of this distribution compared with the same number of randomly oriented vectors (E) indicates that RSS-derived WFs mostly maintain their shape across mean level to within a scale factor.
Figure 8.
Figure 8.
Examples of WFs across spectral density/contrast. A, WFs computed from RSS sets at five values of spectral density (tone density, measured in tones per octave) and four values of spectral contrast (level deviation, measured in decibels SD). All other RSS parameters remained constant. Spectral density increases from left to right; spectral contrast increases from top to bottom. This unit shows similar WFs at the different density/contrast values, but with larger weights under low-contrast conditions. Triplets of numbers represent the minimum, median, and maximum driven rates in response to each RSS set. B, Another example at three density and two contrast values, showing similarity in WF shape. Weights are somewhat larger for the low-contrast condition, although the unit appears to be less responsive overall to lower contrast stimuli.
Figure 9.
Figure 9.
Quantification of WF similarity across spectral density/contrast. A, Distribution of all pairwise normalized inner products for all 13 units studied at different densities and contrasts. Rightward skewed distribution relative to the same number of randomly oriented vectors (B) indicates that RSS-derived WFs mostly maintain the same shape across density and contrast to within a scale factor.
Figure 10.
Figure 10.
Examples of WF predictions. A, The unit with the best prediction of one stimulus set from another. Top panel shows the observed driven rates in response to RSS set 1 sorted by rate (solid line) along with the rates predicted by the WF computed from set 2 (dashed line). Middle panel shows the converse situation, with observed rates in response to RSS set 2 (dashed line) and rates predicted from RSS set 1 (solid line). Bottom panel shows the WFs computed from each of the two sets. B, Same as A for a unit with considerable asymmetry between the predictions. The two stimulus sets, although statistically equivalent and linearly related, activate the neuron differently, resulting in a few large prediction errors because of dissimilar WFs (bottom panel). C, Same as A for a unit near the mean of the population quality factor distribution. As in A, WFs from the two sets match fairly well near CF (bottom panel) but exhibit differences away from CF that essentially account for the poor prediction.
Figure 11.
Figure 11.
Population RSS prediction quality. Quality factors for same-set (gray rectangles) and other-set prediction (black circles) are shown for each of the 225 units tested with complementary RSS sets. Data are plotted as prediction of set 1 (abscissa) against prediction of set 2 (ordinate). Marginal distributions are shown above and to the right. Many same-set predictions are of high quality, indicating that the linear model derived from RSS could be potentially appropriate for these units. Low quality factors for the other-set predictions in this, the easiest possible predictive task (i.e., test stimuli linearly related to the training stimuli), however, indicate substantial nonlinearities in the rate responses of auditory cortex neurons. Labeled data points indicate the examples from Figure 10.
Figure 12.
Figure 12.
Population RSS prediction quality. Quality factors for prediction of set 1 (black diamonds) and prediction of set 2 (gray triangles) are shown for each unit of the population plotted as same-set prediction (abscissa) against other-set prediction (ordinate). Other-set prediction quality increases as same-set quality increases, although at a lesser rate. Most other-set values are lower than the corresponding same-set values, except at low same-set quality factors. These latter units probably represent poor candidates for analysis with RSS constructed around flat spectra.
Figure 13.
Figure 13.
Population RSS prediction quality by electrode penetration position. A, Quality factors for same-set (gray rectangles) and other-set prediction (black circles) are shown for each unit of the population plotted against lateral distance, measured orthogonally from the lateral sulcus. No difference in prediction quality between A1 (less than ∼2 mm) and the lateral belt (more than ∼2 mm) becomes apparent, suggesting that linear analysis is not better suited for one of these cortical areas over the other. B, Median maximum RSS-induced discharge rate for the population shown in A is plotted against lateral distance, indicating that RSS can effectively drive stimuli in both cortical fields.

References

    1. Abeles M, Goldstein Jr MH ( 1970) Functional architecture in cat primary auditory cortex: columnar organization and organization according to depth. J Neurophysiol 33: 172-187. - PubMed
    1. Abeles M, Goldstein Jr MH ( 1972) Responses of single units in the primary auditory cortex of the cat to tones and to tone pairs. Brain Res 42: 337-352. - PubMed
    1. Aertsen AM, Johannesma PI ( 1981) The spectro-temporal receptive field. A functional characteristic of auditory neurons. Biol Cybern 42: 133-143. - PubMed
    1. Anderson JS, Lampl I, Gillespie DC, Ferster D ( 2000) The contribution of noise to contrast invariance of orientation tuning in cat visual cortex. Science 290: 1968-1972. - PubMed
    1. Barbour DL, Wang X ( 2002) Temporal coherence sensitivity in auditory cortex. J Neurophysiol 88: 2684-2699. - PubMed

Publication types

LinkOut - more resources