. 2003 Aug 7;424(6949):669-74.
doi: 10.1038/nature01731.

Neuronal populations and single cells representing learned auditory objects

Affiliations

Neuronal populations and single cells representing learned auditory objects

Timothy Q Gentner et al. Nature. .

Abstract

The neural representations associated with learned auditory behaviours, such as recognizing individuals based on their vocalizations, are not well described. Higher vertebrates learn to recognize complex conspecific vocalizations that comprise sequences of easily identified, naturally occurring auditory objects, which should facilitate the analysis of higher auditory pathways. Here we describe the first example of neurons selective for learned conspecific vocalizations in adult animals--in starlings that have been trained operantly to recognize conspecific songs. The neuronal population is found in a non-primary forebrain auditory region, exhibits increased responses to the set of learned songs compared with novel songs, and shows differential responses to categories of learned songs based on recognition training contingencies. Within the population, many cells respond highly selectively to a subset of specific motifs (acoustic objects) present only in the learned songs. Such neuronal selectivity may contribute to song-recognition behaviour, which in starlings is sensitive to motif identity. In this system, both top-down and bottom-up processes may modify the tuning properties of neurons during recognition learning, giving rise to plastic representations of behaviourally meaningful auditory objects.


Figures

Figure 1
Figure 1
Background and behaviour. a, Schematic of the songbird forebrain auditory system (in blue; Ov, nucleus ovoidalis; L1-L3: field L complex; NCM, caudomedial neostriatum; cHV, caudoventral hyperstriatum). The cmHV is outlined in red. Nuclei in the adjacent vocal ‘song’ system are shown in grey. b, Schematic of the operant apparatus. Animals probed openings in the panel in response to different songs to receive a food reward. c, Acquisition curves showing mean performance (as the proportion of correct responses) for all subjects over the first 60 blocks of training (100 trials per block). Acquisition rates differed significantly between training regimes (F(59,354) = 1.597, P < 0.01). d, Mean proportion of correct responses over the last 500 trials before recording, plotted separately for the two sets of training stimuli (light and dark bars) within each regime. The mean (±s.e.m.) proportion of correct responses at asymptote (0.93 ± 0.01) was significantly above chance (chi-squared test, P ≪ 0.0001), and did not vary significantly between the two training regimes, or within regimes between stimulus sets.
Figure 2
Figure 2
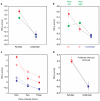
cmHV response strengths. a, RS z-scores (see Methods) for familiar (red and green) and unfamiliar (blue) songs, split by training regime (two-alternative choice, squares; go/no-go, circles). b, RS z-scores as in a but with the two sets of training stimuli and their accompanying responses shown separately (two-alternative choice, green; go/no-go, red). The differences between all three classes for the go/no-go regime were significant (see text). c, Rank-ordered RS z-scores for the three most potent familiar (red) and unfamiliar (blue) stimuli for song-selective (filled symbols) and non-selective neurons (open symbols). The interaction between stimulus rank-order and response selectivity among the familiar songs (red symbols) is significant (F(2,72) = 23.16, P < 0.0001) and shows the strong bias in the song-selective cells for a single stimulus. The difference between the red and blue curves shows the population-level bias for familiar songs. d, RS z-scores for song-selective (filled symbols) and non-selective (open symbols) neurons, with the response to the preferred stimulus (the stimulus that elicited the strongest response) removed from the analysis. The differences are highly significant (see main text). All values are reported as mean ± s.e.m.
Figure 3
Figure 3
Neuronal responses in the cmHV. a, Response of a selective cmHV unit to nine different song stimuli. Familiar songs are outlined in red, unfamiliar songs in blue. The peri-stimulus time histogram (PSTH) of the response is superimposed over the sonogram of each stimulus. The selectivity index, SI, for this cell was the closest to the mean for selective cells (0.497). An example of a single motif is outlined in green. b, Detailed view of the response of the unit in a to the song stimulus denoted by the red star. Traces from top to bottom show the raw spike waveform for a single stimulus presentation (showing excellent single-unit isolation), the PSTH, spike raster plots for several stimulus presentations (showing the reliability of the response), and the stimulus sonogram. The response strength, RS, for this song was 8.93. c, Example of another selective cmHV neuron responding to six different song stimuli, organized as in a. The SI for this cell was 0.259, near the lower limit for selective cells. Horizontal and vertical scale bars show 5 kHz and 1 s, respectively, for a and c.
Figure 4
Figure 4
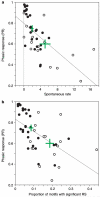
Response scattergrams. a, Scatter plot showing the distribution of phasic responses (PR) across the population of selective (filled symbols) and non-selective (open symbols) cmHV neurons, as a function of spontaneous firing rate (spikes s-1). The means (±s.e.m.) for each class are shown as the green crosses. The line shows the significant linear regression (Fisher’s r to z, r = -0.65, P < 0.0001). The PR is a normalized measure of the tendency of a cell’s discharges to occur in bursts, quantified using the stimulus-driven interspike interval such that the PR for a maximally tonic response is zero, and that for maximally phasic response is 1. The PR of cells depicted in Fig. 3a, c were 0.86 and 0.40, respectively. b, Asin a but with PR plotted as a function of the proportion of motifs that elicited RS values significantly above chance (see Methods). The line shows the significant linear regression (Fisher’s r to z, r = -0.57, P < 0.0001).

Similar articles

Cited by

References

    1. Kroodsma DE, Miller EH, editors. The Design of Animal Communication. MIT Press; Cambridge, Massachusetts: 1999.
    1. Gentner TQ, Margoliash D. In: Acoustic Communication. Simmons AM, Popper AN, Fay RR, editors. Springer; New York: 2002. pp. 324–386.
    1. Gentner TQ, Hulse SH, Bentley GE, Ball GF. Individual vocal recognition and the effect of partial lesions to HVc on discrimination, learning, and categorization of conspecific song in adult songbirds. J. Neurobiol. 2000;42:117–133. - PubMed
    1. Gentner TQ, Hulse SH. Perceptual classification based on the component structure of song in European starlings. J. Acoust. Soc. Am. 2000;107:3369–3381. - PubMed
    1. Kroodsma DE, Miller EH, editors. Ecology and Evolution of Acoustic Communication in Birds. Cornell Univ. Press; Ithaca: 1996.

Publication types