. 2003 Oct 17;278(42):41114-25.
doi: 10.1074/jbc.M306150200. Epub 2003 Aug 7.

Structure-function analysis of the bestrophin family of anion channels

Affiliations

Structure-function analysis of the bestrophin family of anion channels

Takashi Tsunenari et al. J Biol Chem. .

Abstract

The bestrophins are a newly described family of anion channels unrelated in primary sequence to any previously characterized channel proteins. The human genome codes for four bestrophins, each of which confers a distinctive plasma membrane conductance on transfected 293 cells. Extracellular treatment with methanethiosulfonate ethyltrimethylammonium (MTSET) of a series of substitution mutants that eliminate one or more cysteines from human bestrophin1 demonstrates that cysteine 69 is the single endogenous cysteine responsible for MTSET inhibition of whole-cell current. Cysteines introduced between positions 78-99 and 223-226 are also accessible to external MTSET, with MTSET modification at positions 79, 80, 83, and 90 producing a 2-6-fold increase in whole-cell current. The latter set of four cysteine-substitution mutants define a region that appears to mediate allosteric control of channel activity. Mapping of transmembrane topography by insertion of N-linked glycosylation sites and tobacco etch virus protease cleavage sites provides evidence for cytosolic N and C termini and an unexpected transmembrane topography with at least three extracellular loops that include positions 60-63, 212-227, and 261-267. These experiments provide the first structural analysis of the bestrophin channel family.


Figures

FIG. 1
FIG. 1. Sequence analysis of bestrophin family members
A, amino acid sequences of hBest1-hBest4 deduced from cloned cDNA. An arrowhead above the aligned sequences indicates the locations of VMD-associated missense mutations. An asterisk below the aligned sequences indicates those residues that are identical among all human and mouse bestrophins. B, unrooted dendrogram in which the line lengths represent the degree of amino sequence divergence within the conserved ~360 N-terminal amino acids for bestrophin family members from human (hBest), mouse (mBest), and pufferfish (fBest), and their presumptive ancestral sequences at the nodal points. For each bestrophin, the N-terminal domain was considered to end at the position that aligns with amino acid 364 in hBest1 (vertical line in A). C, analysis of the N-terminal domain of bestrophin. Top, amino acid sequence conservation among all human, mouse, pufferfish, and mosquito bestrophins, and Drosophila bestrophins 1 and 2 scored with a PAM350 matrix with an open gap penalty of 5 using ClustalX software; the vertical axis shows the quality score (QI; range, 0–100), higher values of which indicate greater conservation. Bottom, histogram showing the locations of 61 amino acid substitution mutations in hBest1 reported in patients with juvenile or adult onset VMD. The vertical axis shows the number of different amino acid substitutions at each position along the polypeptide. For C, the amino acid numbering refers to hBest1, and therefore gaps in the hBest1 sequence were omitted from the alignments used to generate the upper plot.
FIG. 2
FIG. 2. Whole-cell currents and current-voltage relationships from 293 cells transiently transfected with human bestrophin cDNAs
Left, hBest3; center, hBest1; right, hBest4. For hBest1 and hBest3, whole-cell currents were measured in response to 5-s steps to variable test voltages, followed by a 1-s step to −50 mV. Voltage steps were in 10-mV intervals from −150 to +80 mV starting from a holding potential of 0 mV. For hBest3, the inset shows the whole-cell current response to a 20-s step to −150 mV, followed by a 4-s step to −50 mV. For hBest4, whole-cell currents were measured in response to voltage steps of 320 ms starting from a holding potential of 0 mV, with voltage steps in 10-mV intervals from −150 to +80 mV. The I-V curves for each bestrophin were obtained from five cells (hBest3), four cells (hBest4), or one cell (hBest1) and were normalized to a value of −1.0 at −150 mV before averaging. Current amplitudes at the end of the variable voltage steps were used for the I-V plots. Error bars indicate standard deviations. Recordings were performed with standard extracellular and pipette solutions.
FIG. 3
FIG. 3. Cysteine 69 is the principal target of current inactivation by the sulfhydryl-specific reagent MTSET
293 cells were transiently transfected with wild type (WT) hBest1 (A), hBest1 C69A (upper curve) or hBest1 in which Cys-69 is the only cysteine present (C69-retained; lower curve) (B), or hBest1 mutants in which Cys-23, Cys-42, Cys-221, or Cys-251 are the only cysteines present (C). In the hBest1 mutants that retain a single cysteine, each of the other 4 cysteines has been mutated to alanine. Each panel shows the average current recorded at +80 mV ± S.D. At 1-s intervals, the cells were stepped for 150 ms from a holding potential of 0 mV to test potentials of −120, −80, −40, 0, +40, and +80 mV; the entire cycle was repeated every 10 s for the duration of the experiment. Currents are normalized to 1.0 at the fifth time point, immediately prior to addition of 1 mm MTSET at time 0 (downward arrow). Mean current amplitudes at + 80 mV recorded immediately before MTSET addition were: 1028 ± 217 pA (n = 7; wild type); 610 ± 399 pA (n = 5; C69A); 605 ± 374 pA (n = 5; C69-retained); 462 ± 407 pA (n = 4; C23-retained); 494 ± 236 pA (n = 6; C42-retained); 960 ± 843 pA (n = 5; C221-retained); and 623 ± 508 pA (n = 6; C251-retained).
FIG. 4
FIG. 4. Activation and inactivation of whole-cell currents by MTSET modification of cysteine-substitution mutants
A, each cysteine-substitution mutant was constructed on the C69A background to eliminate the principal endogenous target for MTSET-dependent inactivation. Left, whole-cell currents were recorded and analyzed as described for Fig. 3. Cells expressing C69A/S79C and C69A/F80C were exposed to 20 and 100 µm MTSET, respectively, as their reaction with 1mm MTSET was too rapid to be resolved accurately; all other cells were exposed to 1 mm MTSET. For C69A/V90C, C69A/N99C, and C69A/A226C external MTSET was applied with either standard pipette solution (left panels) or with 20 mm cysteine in the pipette (right panels). Activation of C69A/V90C whole-cell current and inactivation of C69A/A226C whole-cell current by MTSET was unaffected by intracellular cysteine, whereas the rapid partial inactivation of C69A/N99C whole-cell current by MTSET was abolished by intracellular cysteine. Mean current amplitudes at + 80 mV recorded immediately before MTSET addition were: 588 ± 529 pA (n = 3; C69A/S79C); 323 ± 143 pA (n = 4; C69A/F80C); 2490 ± 1047 pA (n = 3; C69A/T87C); 841 ± 716 pA (n = 6; C69A/V90C); 605 ± 307 pA (n = 3; C69A/V90C with 20 mm cysteine); 617 ± 164 pA (n = 4; C69A/N95C); 341 ± 304 pA (n = 4; C69A/N99C); 541 ± 597 pA (n = 4; C69A/N99C with 20 mm cysteine); 834 ± 424 pA (n = 4; C69A/A226C); 347 ± 192 pA (n = 3; C69A/A226C with 20 mm cysteine). B, helical wheel representation of residues 74–91 showing those locations where cysteine substitution and externally applied MTSET confers any measurable effect (small black dots) or a sustained activation (filled symbols).
FIG. 5
FIG. 5. Mapping the transmembrane topography of hBest1 by insertion of N-linked glycosylation sites
293 cells were transfected with the indicated hBest1 mutants tagged at their extreme C termini with the Rim3F4 epitope. Each mutant carries the sequence GGNATGG inserted in-frame after the indicated codon, except for the two mutants that carry SGSGNATGSGS and GGNATNATGG after position 264, indicated as GI-264* and GI-264**, respectively. Cell lysates were incubated with or without peptide:N-glycosidase F (PN-Gase F) and analyzed by immunoblotting with mAb Rim3F4. Addition of a single N-linked oligosaccharide produces a band of lower mobility corresponding to an increase in molecular mass of ~3 kDa (arrow); mutants that were N-glycosylated are indicated in boldface italics. A shorter exposure shows a single band at the wild type MW for GI-177 and a doublet for mutant GI-227. The upper two panels, and the left panel on the 3rd line show wild type hBest1 and the first set of 18 mutants (GI-10 to GI-576); the remaining two panels show the second set of 9 mutants (GI-118 to GI-227).
FIG. 6
FIG. 6. Membrane association and subcellular localization of hBest1 in transfected 293 cells
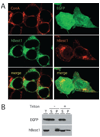
A, left panels, immunolocalization of Rim3F4-tagged hBest1 following plasma membrane labeling of intact cells with concanavalin A. Right panels, immunolocalization of Rim3F4-tagged hBest1 and EGFP. The vast majority of the hBest1 protein accumulates in cytosolic vesicles; EGFP accumulates in both the nucleus and the cytosol. B, centrifugation of cellular homogenates at 25,000 × g for 30 min at 4 °C in the presence or absence of 1% Triton X-100. In the absence of detergent hBest1 is found in the membrane and cytoskeletal pellet. In the presence of Triton X-100 the majority of the hBest1 is solubilized. EGFP is soluble independent of detergent addition. T, total; S, supernatant; P, pellet.
FIG. 7
FIG. 7. Mapping the transmembrane topography of hBest1 by insertion of TEVP cleavage sites
A, control experiment in which an efficiently secreted hGH-TEV-myc-HER3EC fusion protein was expressed in transiently transfected 293 cells, and cell homogenates were subject to TEVP cleavage in the presence or absence of 1% Triton X-100. Immunoblotting with an anti-Myc mAb reveals cleavage at the TEVP site and release of the C-terminal myc-HER3EC fragment only in the presence of TEVP and detergent. The diagram illustrates the exclusion of added TEVP (scissors) from the interior of an intact membrane vesicle (left) and the access of TEVP to the vesicle interior in the presence of detergent (right). The vesicle lumen is topologically equivalent to the outside of the cell. B, TEVP cleavage of the indicated hBest1 mutants carrying a TEVP site insertion. Each mutant is tagged at the extreme C terminus with the Rim3F4 epitope, and proteins were visualized by immunoblotting with mAb Rim3F4. In the 1st 5 panels, each mutant hBest1 carries the sequence GGENLYFQGGG inserted inframe after the indicated codon. The TI-10–3Myc mutant (lower right autoradiogram) carries an additional insertion of 3 Myc epitopes N-terminal to the TEVP cleavage site. The cleavage of this mutant by TEVP (scissors) is shown schematically at the lower right. A part of a membrane bilayer (double lines) separates the lumen (upper area) from the cytosol (lower area). Cleavage occurs on the cytosolic face of the membrane. N, N terminus; 3Myc, triple Myc epitope tag. For each mutant, the molecular mass of the C-terminal fragment released by TEVP cleavage (asterisk) is determined by the point of insertion. Bars indicate molecular mass standards (from top to bottom) of 173, 111, 80, 61, 49, 36, and 25 kDa.
FIG. 8
FIG. 8. Summary of structural and functional characteristics of hBest1
A, hydropathy profile calculated according to Kyte and Doolittle (52) with a window size of 19 residues. Increasing hydropathy is upward, and the six potential transmembrane segments are indicated by horizontal bars and lettered A–F. B, summary of hBest1 modifications. Top, MTSET modification of endogenous and introduced cysteines. Endogenous cysteine 69 and cysteine substitutions at positions 78, 79, 80, 83, 84, 87, 90, 99, 223, and 226 showed clear alterations in membrane current following exposure to MTSET; these positions are represented by bars above the horizontal line. Cysteine substitutions at positions 12, 16, 60, 71, 74, 86, 95, 108, 133, 169, 185, 225, 231, 268, and 293 produced whole-cell currents that were unaffected or minimally affected by exposure to MTSET; these are represented by bars below the horizontal line. Cysteine substitutions that produced little or no measurable whole-cell current are not shown. Center, N-glycosylation site insertions. Insertions after positions 60, 63, 212, 218, 223, 227, 261, 264, and 267 were glycosylated and are therefore presumed to face the vesicle lumen, topologically equivalent to the outside of the cell; these are represented by bars above the horizontal line. Insertions after positions 10, 14, 56, 98, 154, 166, 177, 180, 193, 197, 326, 333, 427, and 576 were not glycosylated and are represented by shorter bars below the horizontal line. Bottom, TEVP cleavage site insertions. Insertions after positions 10, 154, 323, 355, 416, and 498 showed moderate or strong TEVP cleavage in the absence of added detergent and are therefore presumed to face the cytosol; they are represented by bars below the horizontal line, with bar height correlating with cleavage efficiency. Insertions after positions 63 and 261 showed enhanced TEVP cleavage in the presence of added detergent and are therefore presumed to face the vesicle lumen; these are represented by bars with circles above the horizontal line. Insertions that show very weak cleavage are represented by the smallest bars (positions 56, 60, 118, and 218) and were not incorporated into the transmembrane topography model. C, comparison of five models of hBest1 transmembrane topography. The four models on the left represent the most favored predictions based only on the hydropathy profile (see “Discussion”). The fifth model (right) accounts for the experimental data presented here. It is decorated with the locations of informative insertions of glycosylation sites (schematic sugar chains on the outer face of the protein), TEVP cleavage sites (scissors on the inner face of the protein), and the sites of cysteine modification by MTSET (solid circles).

Similar articles

Cited by

References

    1. Jentsch TJ, Gunther W. BioEssays. 1997;19:117–126. - PubMed
    1. George AL, Bianchi L, Link EM, Vanoye CG. Curr. Biol. 2001;11:R620–R628. - PubMed
    1. Hille B. Ion Channels of Excitable Membranes. Sunderland, MA: Sinauer Associates, Inc.; 2001.
    1. Gunther W, Luchow A, Cluzead F, Vandewalle A, Jentsch TJ. Proc. Natl. Acad. Sci. U. S. A. 1998;95:8075–8080. - PMC - PubMed
    1. Iyer R, Iverson TM, Accardi A, Miller C. Nature. 2002;419:715–718. - PubMed

Publication types

MeSH terms