. 2003 Aug 15;31(16):4717-28.
doi: 10.1093/nar/gkg689.

Regulation of TCF ETS-domain transcription factors by helix-loop-helix motifs

Affiliations

Regulation of TCF ETS-domain transcription factors by helix-loop-helix motifs

Julie Stinson et al. Nucleic Acids Res. .

Abstract

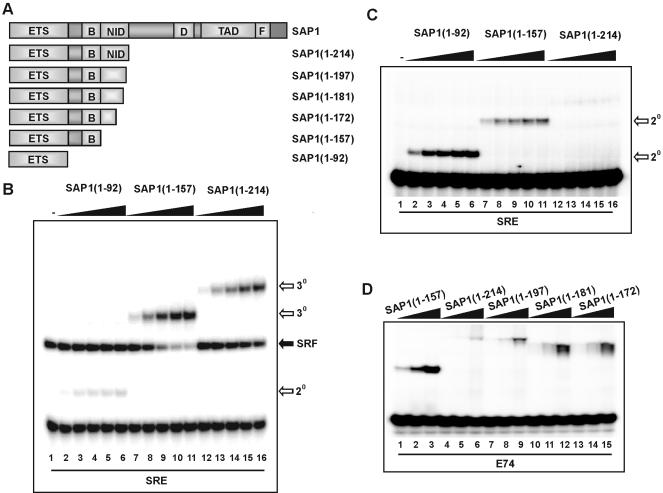
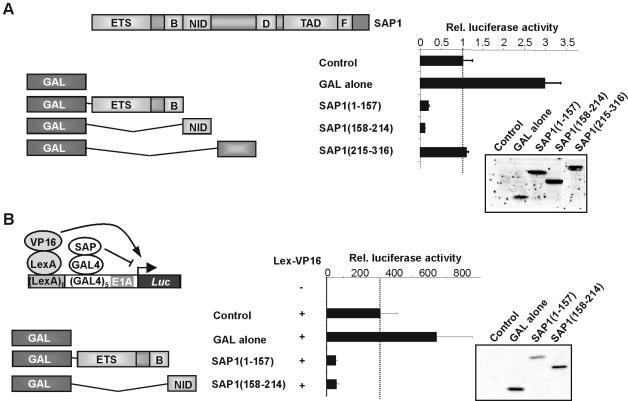
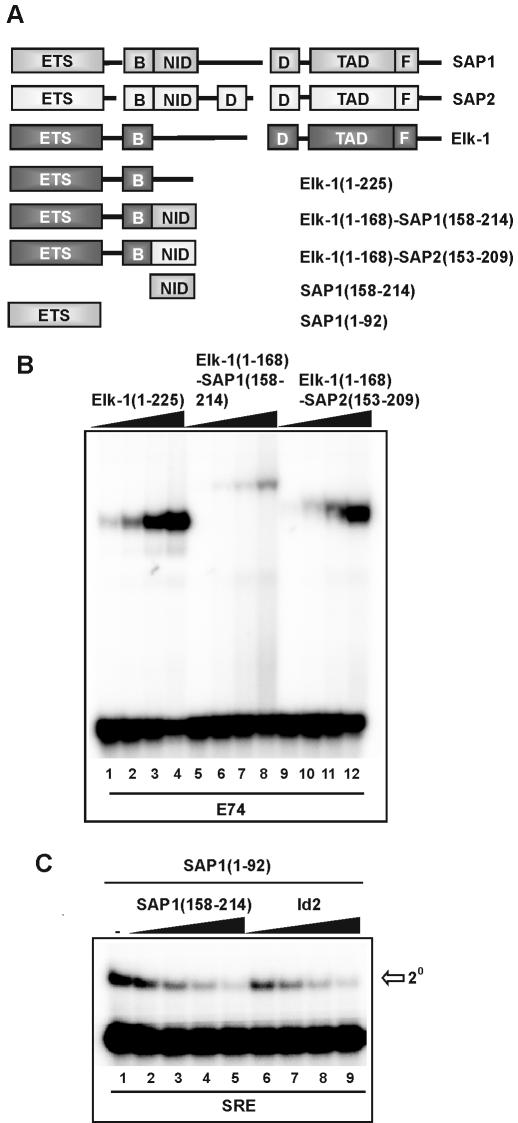
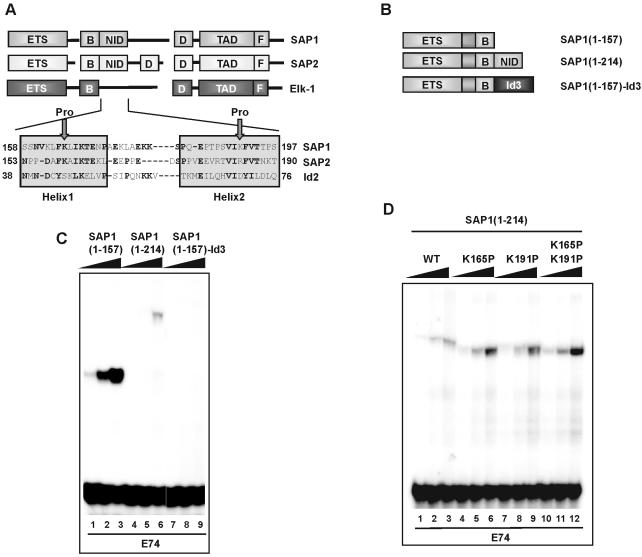
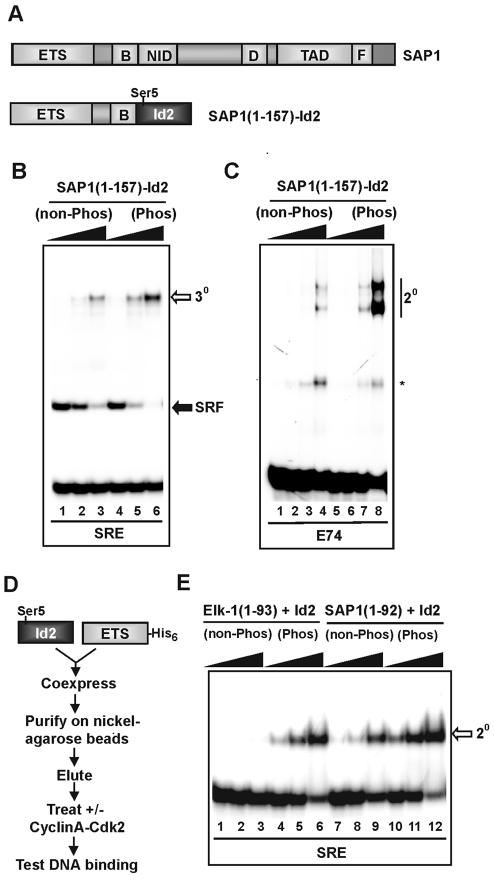
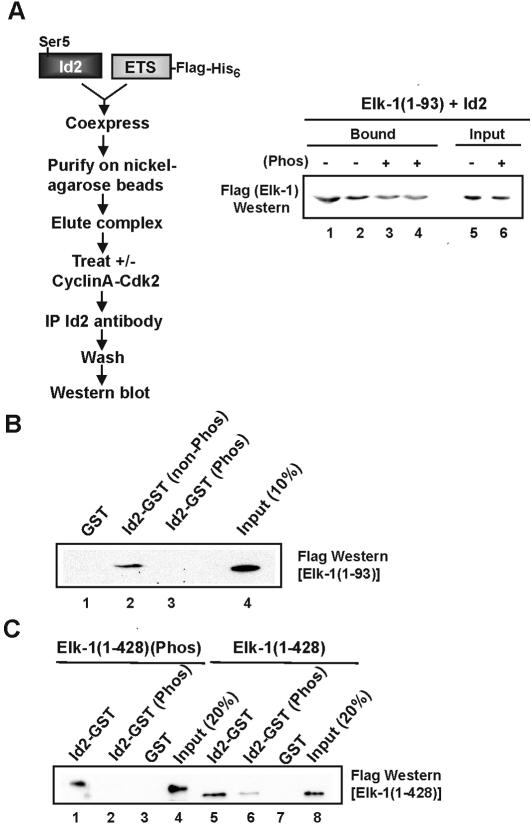
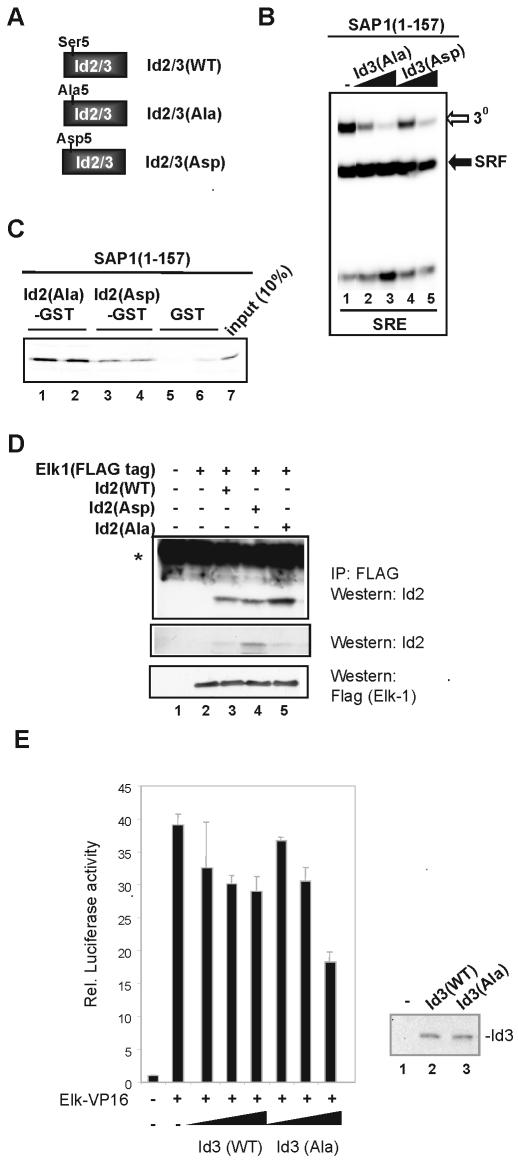
DNA binding by the ternary complex factor (TCF) subfamily of ETS-domain transcription factors is tightly regulated by intramolecular and intermolecular interactions. The helix-loop-helix (HLH)-containing Id proteins are trans-acting negative regulators of DNA binding by the TCFs. In the TCF, SAP-2/Net/ERP, intramolecular inhibition of DNA binding is promoted by the cis-acting NID region that also contains an HLH-like motif. The NID also acts as a transcriptional repression domain. Here, we have studied the role of HLH motifs in regulating DNA binding and transcription by the TCF protein SAP-1 and how Cdk-mediated phosphorylation affects the inhibitory activity of the Id proteins towards the TCFs. We demonstrate that the NID region of SAP-1 is an autoinhibitory motif that acts to inhibit DNA binding and also functions as a transcription repression domain. This region can be functionally replaced by fusion of Id proteins to SAP-1, whereby the Id moiety then acts to repress DNA binding in cis. Phosphorylation of the Ids by cyclin-Cdk complexes results in reduction in protein-protein interactions between the Ids and TCFs and relief of their DNA-binding inhibitory activity. In revealing distinct mechanisms through which HLH motifs modulate the activity of TCFs, our results therefore provide further insight into the role of HLH motifs in regulating TCF function and how the inhibitory properties of the trans-acting Id HLH proteins are themselves regulated by phosphorylation.


Figures

Figure 1
Figure 1
The SAP-1 NID has a DNA-binding autoinhibitory function. (A) Schematic diagram of SAP-1 domains illustrating regions contained in truncated SAP-1 proteins. Numbers in brackets indicate N- and C-terminal amino acid residues of truncations, with respect to full-length protein. (B) Gel retardation analysis of binary (2o) and ternary (3o) complex formation by SAP-1(1–92) (lanes 2–6), SAP-1(1–157) (lanes 7–11) or SAP-1(1–214) (lanes 12–16) with coreSRF and c-fos SRE. The locations of binary SRF–DNA complexes are indicated. In vitro translated SAP-1 truncations were diluted to equal molar concentrations, and increasing volumes were added (0.2, 0.6, 1, 1.4 and 1.8 µl). (C) Binary (2o) complex formation of SAP-1 truncations on c-fos SRE as in (B) except SRF was omitted. (D) Gel retardation analysis of binary complexes on the E74-binding site by SAP-1 truncations: SAP-1(1–157) (lanes 1–3), SAP-1(1–214) (lanes 4–6), SAP-1(1–197) (lanes 7–9), SAP-1(1–181) (lanes 10–12) and SAP-1(1–172) (lanes 13–15). SAP-1 proteins were diluted to equal molar concentrations, and 0.25 µl was used in lanes 1, 4, 7, 10 and 13; 0.75 µl in lanes 2, 5, 8, 11 and 14; and 2.25 µl in lanes 3, 6, 9, 12 and 15.
Figure 2
Figure 2
The SAP-1 NID is a transcriptional repression domain. (A) The GAL4 DNA-binding domain (amino acids 1–147) was fused to a series of truncated SAP-1 proteins (amino acids are shown in brackets). Cells were co-transfected with 1 µg of pG5tkluc reporter vector, 0.5 µg of pCH110 and 0.1 µg of either pCMV alone (lane 1), pCMVGAL (lane 2), pCMVGAL-SAP-1(1–157) (lane 3), pCMVGAL-SAP-1(158–214) (lane 4), or pCMVGAL-SAP-1(215–316) (lane 5). Data presented are normalised with respect to β-gal activity, and values are given relative to control plasmid (taken as 1). Protein expression levels in 30 µl whole-cell extracts of transfected cells were determined by western analysis, using GAL4-specific antibodies. (B) GAL–SAP-1 truncations were tested for repression function using a LexA-VP16-activated LexA-GAL4-luc reporter. 293 cells were transfected with 1 µg of L8G5E1aluc reporter, 0.5 µg of pCH110 and either 0.2 µg of LexA-VP16 (lanes 2–5) or empty plasmid (lane 1) in addition to 0.1 µg of either pCMVGAL (lane 3), pCMVGAL-SAP-1(1–157) (lane 4) or pCMVGAL-SAP-1(158–214) (lane 5). Data presented are normalised with respect to β-galactosidase activity, and values are given relative to control plasmid (taken as 1). Protein expression levels were determined by western analysis of 10 µl of protein extract using GAL4-specific antibodies.
Figure 3
Figure 3
The NID inhibits DNA binding in trans and in a heterologous context. (A) Schematic diagram of SAP-1 domains illustrating regions contained in full-length Elk-1, SAP-1 and SAP-2 proteins. Gaps are introduced to permit alignment of the conserved regions. The structures of the isolated domains used and chimeric Elk-1–NID constructs are indicated below (numbers in brackets indicate N- and C-terminal amino acid residues of truncations, with respect to full-length proteins). (B) Gel retardation analysis of the indicated wild-type and chimeric Elk-1 proteins on the E74-binding site. In vitro translated proteins were diluted to equal molar concentrations, and added in increasing amounts (0.2, 0.6, 1.8 and 5.4 µl) (indicated schematically above each set of lanes by a triangle). (C) SAP-1 NID inhibits binding of the SAP-1 ETS domain to the c-fos SRE in trans. In vitro translated SAP-1 NID and Id2 were diluted to equal molar amounts, and 0.5, 1, 2 and 4 µl (indicated schematically above each set of lanes by a triangle) were added in the presence of a constant amount of SAP-1(1–92). Total amounts of reticulocyte lysate were equalised by adding unprogrammed lysate.
Figure 4
Figure 4
Id proteins can functionally replace the NID. (A) Alignment of the sequences of the SAP-1 and SAP-2 NID domains, and the HLH domain of Id2. The N- and C-terminal amino acid residues with respect to full-length protein are indicated. Arrows indicate the positions of insertion of proline residues in the SAP-1(1–214) (K165P) and (K191P) mutants. (B) Schematic diagram of chimeric SAP-1 constructs used in (C) and (D). (C and D) Gel retardation analysis of the indicated SAP-1 fusion proteins on the E74-binding site. In vitro translated proteins were normalised to equal molar concentrations, and added in increasing relative amounts (1, 2.5 and 6) (C) and (1, 2 and 4) (D) (indicated schematically above each set of lanes by a triangle).
Figure 5
Figure 5
Phosphorylation of Id reduces its DNA-binding inhibitory properties. (A) Schematic diagram of the chimeric SAP-1–Id2 construct. The location of the cyclinA–Cdk2 phosphorylation site (Ser5) is indicated. (B) Gel retardation analysis of SAP-1–Id2 chimeras in the absence and presence of prior phosphorylation by cyclinA–Cdk2 complexes. The SAP-1–Id2 chimeric protein was expressed in bacteria and purified. SAP-1–Id2 was either left unphosphorylated or was phosphorylated by cyclinA–Cdk2. Increasing amounts (24, 48 and 96 ng) were tested in a gel retardation assay for effects on ternary (3o) complex formation with coreSRF and c-fos SRE. (C) As in (B), except SRF was omitted from the reaction, the E74-binding site was used, and binary (2o) complexes detected. SAP-1–Id2 was added at 12, 24, 48 and 96 ng (indicated schematically above each set of lanes by a triangle). The asterisk represents a complex formed from truncated SAP-1–Id protein. (D) Methodology for co-expressing Id2 and the ETS DNA- binding domain of TCFs. Id2 and either the Elk-1 or SAP-1 ETS-domain were co-expressed in E.coli from a single plasmid. Induced protein complexes were purified, and used in subsequent experiments. (E) Complexes containing Id2 and the ETS-domain of either Elk-1 or SAP-1 were either left unphosphorylated or phosphorylated with cyclinA–Cdk2, and tested for their ability to bind to the c-fos SRE in gel retardation analysis. Aliquots of 9.5 (lanes 1 and 4), 19 (lanes 2 and 5) and 57 ng (lanes 3 and 6) of Elk-1(1–93)–Id2 complexes, and 15 (lanes 7 and 10), 30 (lanes 8 and 11) and 90 ng (lanes 9 and 12) of SAP-1(1–157)–Id2 complexes were added.
Figure 6
Figure 6
Effect of phosphorylation on Id2 interactions with Elk-1 in vitro. (A) A flow diagram depicting steps used to test binding of the Elk-1 ETS-domain and Id2 is shown on the left. Id2 and the Elk-1 ETS-domain were co-expressed in E.coli from a single plasmid. Induced protein complexes were purified and used in subsequent experiments. Purified complexes were either phosphorylated with cyclinA–Cdk2 or mock treated and immunoprecipitated with Id2 antibody coupled to agarose beads (∼1 µg of total purified protein complex was used). After washing, the remaining Elk-1 in the complex was detected by western blot using Flag antibody. Duplicate samples are shown in lanes 1 and 2, and 3 and 4. Ten percent of the input protein is shown. (B) GST pull-down analysis of the ETS-domain (amino acids 1–93) of Elk-1 (1 µg) with 1.5 µg of GST (lane 1) or 1.5 µg of Id2–GST fusion protein, with or without prior phosphorylation by cyclinA–Cdk2 (lanes 3 and 2, respectively). Lane 4 shows 10% of input protein. (C) GST pull-down analysis of full-length Elk-1 (amino acids 1–428) with Id2–GST. Elk-1 (220 ng) was left unphosphorylated (lanes 5–8) or phosphorylated with Erk (lanes 1–4). Id2–GST (1.5 µg) was either non-phosphorylated (lanes 1 and 5) or phosphorylated with cyclinA–Cdk2 (lanes 2 and 6). GST (1.5 µg) was used as a control (lanes 3 and 7). Lanes 4 and 8 show 20% of input. Precipitated Elk-1 was detected using anti-Flag antibody.
Figure 7
Figure 7
Phosphomimetics imitate phosphorylation of Id. (A) Schematic illustration of a series of mutants of Ser5 in Id2 and Id3. (B) Gel retardation analysis of in vitro translated SAP-1 (amino acids 1–157) in a ternary complex (3o) with coreSRF and c-fos SRE. Complexes were challenged with increasing amounts, 0.5 (lanes 2 and 4) and 2.5 µl (lanes 3 and 5), of equimolar stocks of in vitro-translated Id3 Ala5 or Asp5 mutants. (C) GST pull-down analysis of SAP-1(1–157) binding to the indicated mutant GST–Id2 fusions. Lanes 1 and 2 [Id2(Ala)–GST], lanes 3 and 4 [Id2(Asp)–GST] and lanes 5 and 6 (GST) represent duplicate samples; lane 7 shows 10% of input. (D) Co-immunoprecipitation of Id2 mutants with Elk-1 from 293T cells. Cells were either mock transfected with empty vector (lane 1) or transfected with 7.5 µg of Elk-1 (lane 2), or 7.5 µg of Elk-1 and 7.5 µg of either Id2(WT), Id2(Asp) or Id2(Ala) (lanes 3, 4 and 5, respectively). Elk-1 complexes were precipitated using anti-Flag antibody coupled to Sepharose beads, and bound protein was detected by western analysis with Id2 antibody. Westerns with Id2 and Flag antibodies were used to compare relative expression levels of Id2 and Elk-1 in the input samples (bottom two panels). (E) Reporter gene analysis of Id-mediated inhibition of TCF activity. Cells were co-transfected with 100 ng of pSRE-luc reporter vector, 100 ng of pCH110, 10 ng of pRSV-Elk-VP16 (lanes 2–7) and increasing amounts of wild-type Id3 and Id3(Ala) (0.3, 1 and 3 µg) (indicated schematically with a triangle under each set of bars). Data presented are duplicate samples normalised with respect to β-gal activity, and values are given relative to reporter alone (taken as 1). Protein expression levels in whole-cell extracts of transfected cells were determined by western analysis, using Id3-specific antibodies (right hand panel). Extracts were analysed from samples taken from untransfected cells (lane 1) and cells transfected with 3 µg of wild-type Id3 (lane 2) or Id3(Ala) (lane 3).

Similar articles

Cited by

References

    1. Treisman R. (1994) Ternary complex factors: growth regulated transcriptional activators. Curr. Opin. Genet. Dev., 4, 96–101. - PubMed
    1. Sharrocks A.D. (2002) Complexities in ETS-domain transcription factor function and regulation; lessons from the TCF subfamily. Biochem. Soc. Trans., 30, 1–9. - PubMed
    1. Gille H., Sharrocks,A.D. and Shaw,P.E. (1992) Phosphorylation of transcription factor p62TCF by MAP kinase stimulates ternary complex formation at c-fos promoter. Nature, 358, 414–417. - PubMed
    1. Gille H., Kortenjann,M., Thomae,O., Moomaw,C., Slaughter,C., Cobb,M.H. and Shaw,P.E. (1995) ERK phosphorylation potentiates Elk-1-mediated ternary complex formation and transactivation. EMBO J., 14, 951–962. - PMC - PubMed
    1. Sharrocks A.D. (1995) ERK2/p42 MAP kinase stimulates both autonomous and SRF-dependent DNA binding by Elk-1. FEBS Lett., 368, 77–80. - PubMed

Publication types

MeSH terms