. 2003 Aug 15;31(16):4847-55.
doi: 10.1093/nar/gkg679.

Zinc finger-dependent HIV-1 nucleocapsid protein-TAR RNA interactions

Affiliations

Zinc finger-dependent HIV-1 nucleocapsid protein-TAR RNA interactions

Nick Lee et al. Nucleic Acids Res. .

Abstract

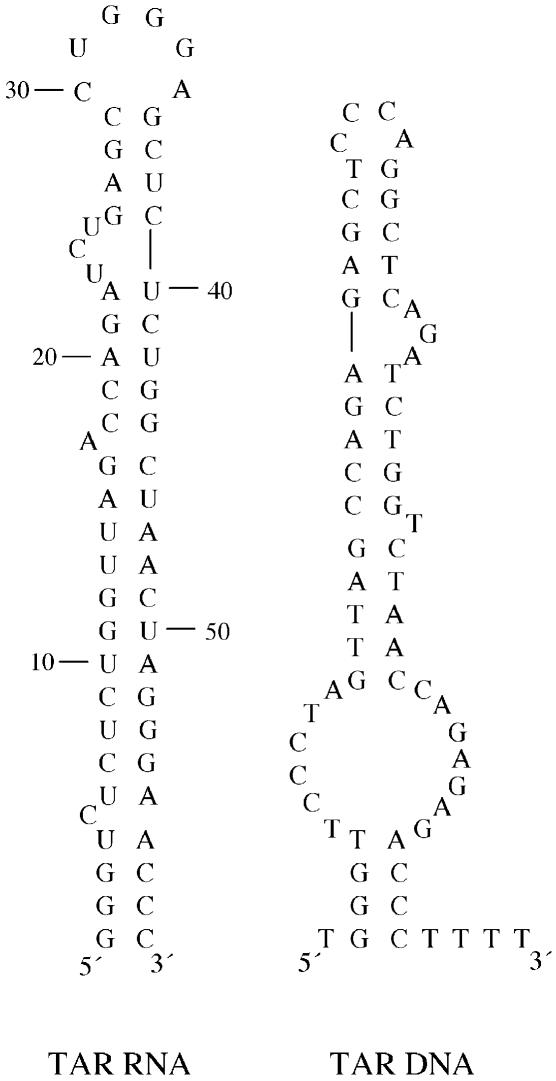
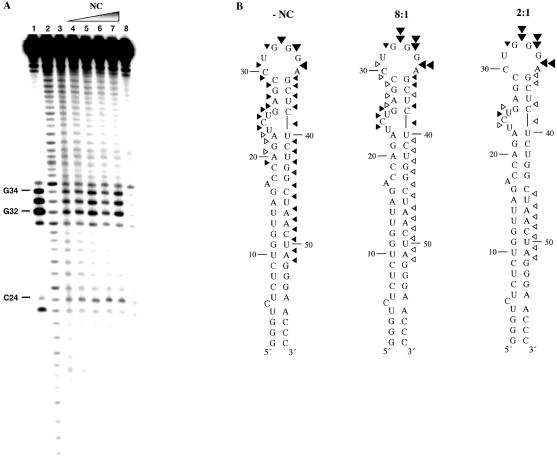
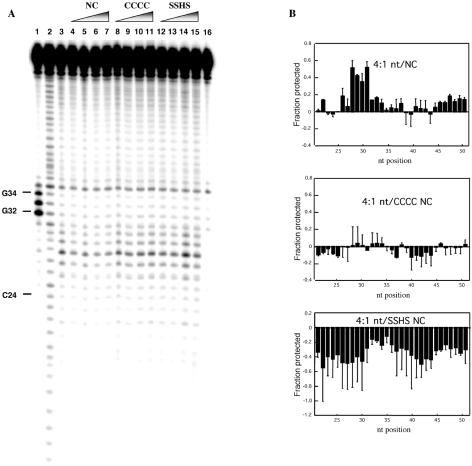
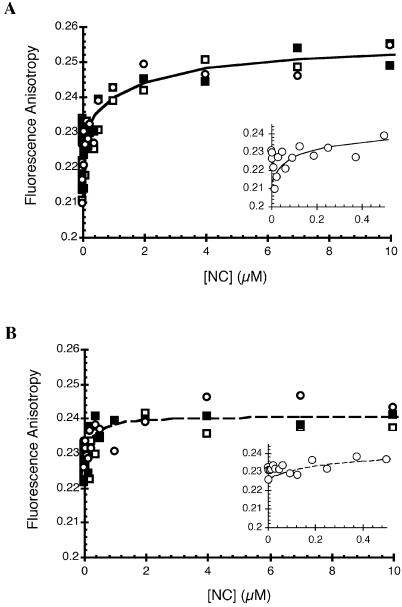
In the minus-strand transfer step of HIV-1 reverse transcription, the nucleocapsid protein (NC) promotes annealing of the 3' 'R' (repeat) region of the RNA genome to its complementary sequence located in the newly synthesized minus-strand strong-stop DNA. The R region contains the highly stable transactivation response (TAR) RNA hairpin. To gain insights into the molecular details of TAR RNA-NC interactions, we carried out hydroxyl radical footprinting, as well as gel-shift and fluorescence anisotropy binding assays using wild-type and mutant forms of NC. Our results support the conclusion that NC variants with mutations in their zinc finger domains have dramatically altered TAR RNA binding interactions relative to wild-type NC. These data demonstrate that a specific zinc finger architecture is required for optimal TAR RNA binding, and help to explain the requirement for the zinc finger motifs of NC in its role as a nucleic acid chaperone in minus-strand transfer.


Figures

Figure 1
Figure 1
Predicted secondary structures of the 59-nt TAR RNA (left) and complementary 64-nt TAR DNA (right) used in this study. The four thymidine residues at the 3′-end of the TAR DNA are not part of the actual R region sequence in HIV-1. Structures were determined at 37°C using the program mfold (31).
Figure 2
Figure 2
(Opposite and above) Fe–EDTA footprinting of [32P]-TAR RNA in the presence of NC and with or without TAR DNA. (A) Footprinting experiments performed in the absence of TAR DNA. Lanes 1 and 2, RNase T1 and alkaline hydrolysis ladders of radiolabeled TAR RNA, respectively. Lane 3, Fe–EDTA cleavage profile of 1 µM [32P]-TAR RNA in the absence of NC. Lanes 4–7, cleavage profiles of 1 µM [32P]-TAR RNA in the presence of the following concentrations of NC: 3.7 (lane 4), 7.4 (lane 5), 14.8 (lane 6) and 29.5 µM (lane 7) to achieve 16:1, 8:1, 4:1 and 2:1 nt:NC ratios, respectively. Lane 8, control reaction carried out in the absence of NC and Fe–EDTA. (B) Quantification of the Fe–EDTA footprinting results shown in (A) mapped onto the backbone of TAR RNA. Results of experiments in the absence of NC (left) and in the presence of 8:1 (middle) and 2:1 (right) nt:NC ratios are shown. Symbols represent the following extent of cleavage: 0.20–0.40% (open arrowheads), 0.41–0.70% (closed small arrowheads), 0.71–0.85% (closed large arrowheads) and 0.86–1.10% (double arrowheads). (C) Footprinting experiments performed in the presence of TAR DNA. Lanes 1 and 2, RNase T1 and alkaline hydrolysis ladders, respectively. Lanes 3 and 4, cleavage profiles of 1 µM [32P]-TAR RNA in the absence and presence of 1.5 µM TAR DNA, respectively. Lane 5, cleavage profile of TAR RNA in a heat-annealed TAR RNA/DNA complex. Lanes 6–8, TAR RNA was preincubated for 30 min with TAR DNA and the following concentrations of NC prior to Fe–EDTA cleavage: 9.7 (16:1 nt:NC), 19 (8:1 nt:NC) and 39 µM (4:1 nt:NC). Lane 9, control reaction carried out in the absence of NC and Fe–EDTA. (D) Quantification of the Fe–EDTA footprinting results shown in (C), lanes 5 and 8, mapped onto the backbone of TAR RNA for the NC-annealed (4:1 nt:NC ratio, left) and heat-annealed (right) TAR RNA/DNA complex. Symbols have the same meaning as in (B).
Figure 2
Figure 2
(Opposite and above) Fe–EDTA footprinting of [32P]-TAR RNA in the presence of NC and with or without TAR DNA. (A) Footprinting experiments performed in the absence of TAR DNA. Lanes 1 and 2, RNase T1 and alkaline hydrolysis ladders of radiolabeled TAR RNA, respectively. Lane 3, Fe–EDTA cleavage profile of 1 µM [32P]-TAR RNA in the absence of NC. Lanes 4–7, cleavage profiles of 1 µM [32P]-TAR RNA in the presence of the following concentrations of NC: 3.7 (lane 4), 7.4 (lane 5), 14.8 (lane 6) and 29.5 µM (lane 7) to achieve 16:1, 8:1, 4:1 and 2:1 nt:NC ratios, respectively. Lane 8, control reaction carried out in the absence of NC and Fe–EDTA. (B) Quantification of the Fe–EDTA footprinting results shown in (A) mapped onto the backbone of TAR RNA. Results of experiments in the absence of NC (left) and in the presence of 8:1 (middle) and 2:1 (right) nt:NC ratios are shown. Symbols represent the following extent of cleavage: 0.20–0.40% (open arrowheads), 0.41–0.70% (closed small arrowheads), 0.71–0.85% (closed large arrowheads) and 0.86–1.10% (double arrowheads). (C) Footprinting experiments performed in the presence of TAR DNA. Lanes 1 and 2, RNase T1 and alkaline hydrolysis ladders, respectively. Lanes 3 and 4, cleavage profiles of 1 µM [32P]-TAR RNA in the absence and presence of 1.5 µM TAR DNA, respectively. Lane 5, cleavage profile of TAR RNA in a heat-annealed TAR RNA/DNA complex. Lanes 6–8, TAR RNA was preincubated for 30 min with TAR DNA and the following concentrations of NC prior to Fe–EDTA cleavage: 9.7 (16:1 nt:NC), 19 (8:1 nt:NC) and 39 µM (4:1 nt:NC). Lane 9, control reaction carried out in the absence of NC and Fe–EDTA. (D) Quantification of the Fe–EDTA footprinting results shown in (C), lanes 5 and 8, mapped onto the backbone of TAR RNA for the NC-annealed (4:1 nt:NC ratio, left) and heat-annealed (right) TAR RNA/DNA complex. Symbols have the same meaning as in (B).
Figure 3
Figure 3
Fe–EDTA footprinting of [32P]-TAR RNA in the presence of wild-type and mutant NC. (A) Denaturing polyacrylamide gel showing the Fe–EDTA cleavage profiles of 200 nM [32P]-TAR RNA in the presence of NC (lanes 4–7), CCCC NC (lanes 8–11) and SSHS NC (lanes 12–15) present at the following nt:protein ratios: 16:1 (lanes 4, 8 and 12), 8:1 (lanes 5, 9 and 13), 4:1 (lanes 6, 10 and 14) and 2:1 (lanes 7, 11 and 15). Lane 3, cleavage pattern of TAR RNA in the absence of NC. Lanes 1 and 2, RNase T1 and alkaline hydrolysis ladders, respectively. Lane 16, control reaction carried out in the absence of NC and Fe–EDTA. (B) Bar graph representation of the protection profiles of TAR RNA based on the data shown in (A). Data are plotted for the protection observed in the presence of a 4:1 nt:protein ratio in each case. Positive and negative values indicate protection from cleavage and enhanced cleavage, respectively, compared to radiolabeled TAR RNA cleaved in the absence of mutant or wild-type NC. Data are based on quantification of two gels with the average value shown by the solid bar and the standard deviation indicated.
Figure 4
Figure 4
Fluorescence anisotropy analysis of the binding of wild-type and CCCC NC to 5′-Cy3-TAR RNA. Data were analyzed as described in Materials and Methods. Three independent binding curves are shown as open squares, closed squares and open circles for (A) wild-type and (B) CCCC NC. The insets show an expanded view of the binding curves at the lower NC concentrations for a single data set. The dashed and solid lines correspond to the fit of the data to one- (B) and two-site (A) binding models, respectively.
Figure 5
Figure 5
NC-induced TAR RNA aggregation assay. (A) Native 8% polyacrylamide gel showing aggregation of TAR RNA in the presence of wild-type and mutant NC. [32P]-TAR RNA (3 nM) was incubated in the absence of NC (lane 1), or in the presence of 0.37, 0.75, 1.5, 2.2 and 3.0 µM NC (lanes 2–6), 1.1, 2.2, 4.5, 6.7 and 9.0 µM CCCC NC (lanes 7–11), 1.1, 2.2, 4.5, 6.7 and 9.0 µM SSHS NC (lanes 12–16), and 0.37, 0.75, 1.5 and 2.25 µM 1-1 NC (lanes 17–20). The arrowheads show the position of free TAR RNA and the TAR RNA–NC aggregate. (B) Graph showing concentration-dependent TAR RNA aggregation in the presence of wild-type and mutant NC. Data points are based on quantification of the gel shown in (A).

Similar articles

Cited by

References

    1. South T.L., Kim,B., Hare,D.R. and Summers,M.F. (1990) Zinc fingers and molecular recognition: structure and nucleic acid binding studies of an HIV zinc finger-like domain. Biochem. Pharmacol., 40, 123–129. - PubMed
    1. Summers M.F., Henderson,L.E., Chance,M.R., Bess,J.W.,Jr, South,T.L., Blake,P. R., Sagi,I., Perez-Alvarado,G., Sowder,R.C.,III, Hare,D.R. et al. (1992) Nucleocapsid zinc fingers detected in retroviruses: EXAFS studies of intact viruses and the solution-state structure of the nucleocapsid protein from HIV-1. Protein Sci., 1, 563–574. - PMC - PubMed
    1. Berg J.M. (1986) Potential metal-binding domains in nucleic acid binding proteins. Science, 232, 485–487. - PubMed
    1. de Rocquigny H., Gabus,C., Vincent,A., Fournie-Zaluski,M.C., Roques,B.P. and Darlix,J.L. (1992) Viral RNA annealing activities of human immunodeficiency virus type 1 nucleocapsid protein require only peptide domains outside the zinc fingers. Proc. Natl Acad. Sci. USA, 89, 6472–6476. - PMC - PubMed
    1. Darlix J.L., Lapadat-Tapolsky,M., de Rocquigny,H. and Roques,B.P. (1995) First glimpses at structure-function relationships of the nucleocapsid protein of retroviruses. J. Mol. Biol., 254, 523–537. - PubMed

Publication types