Comparative Study
. 2003 Aug 19;100(17):10043-8.
doi: 10.1073/pnas.1732949100. Epub 2003 Aug 8.

Atypical expansion in mice of the sensory neuron-specific Mrg G protein-coupled receptor family

Affiliations
Comparative Study

Atypical expansion in mice of the sensory neuron-specific Mrg G protein-coupled receptor family

Mark J Zylka et al. Proc Natl Acad Sci U S A. .

Abstract

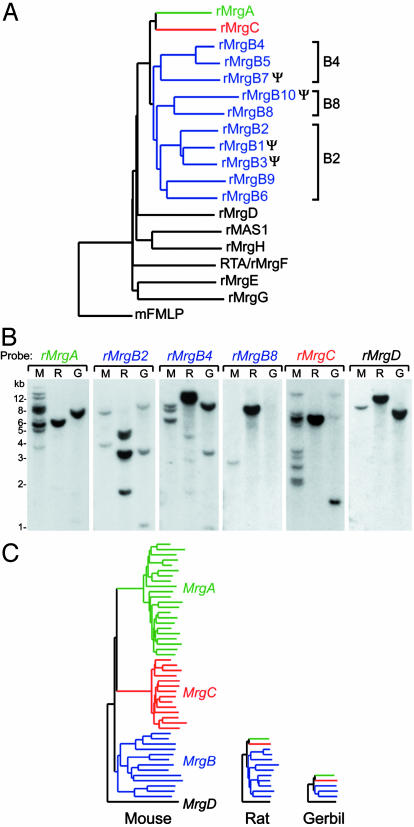
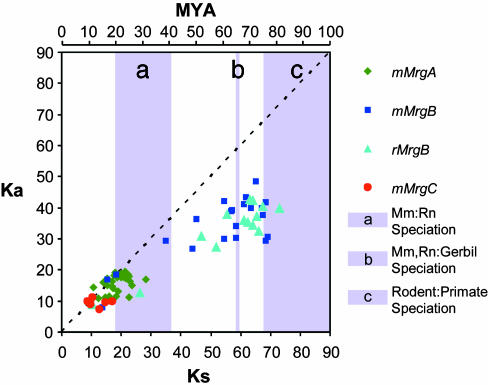
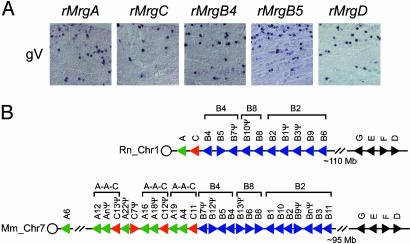
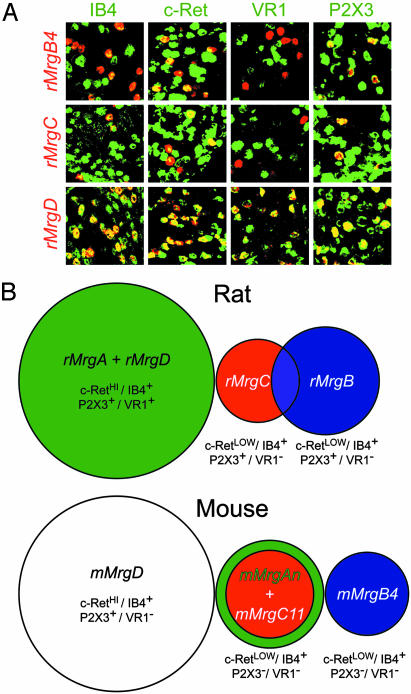
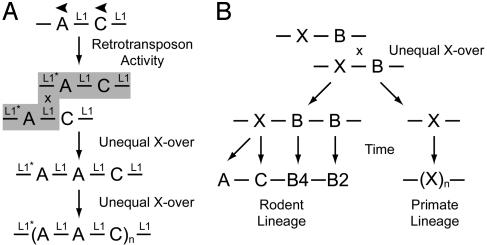
The Mas-related genes (Mrgs) comprise a family of >50 G protein-coupled receptors (GPCRs), many of which are expressed in specific subsets of nociceptive sensory neurons in mice. In contrast, humans contain a related but nonorthologous family of genes, called MrgXs or sensory neuron-specific receptors, of which many fewer appear to be expressed in sensory neurons. To determine whether the diversity of murine Mrgs is generic to rodents or is an atypical feature of mice, we characterized MrgA, MrgB, MrgC, and MrgD subfamilies in rat and gerbil. Surprisingly, although mice have approximately 22 MrgA and approximately 14 MrgC genes, rats and gerbils have just a single MrgA and MrgC gene. This murine-specific expansion likely reflects recent retrotransposon-mediated unequal crossover events. The expression of Mrgs in rat sensory ganglia suggests that the extensive cellular diversity in mice can be simplified to a core subset of approximately four different genes (MrgA, MrgB, MrgC, and MrgD), defining a similar number of neuronal subpopulations. Our results suggest more generally that mouse-human genomic comparisons may sometimes reveal differences atypical of rodents.


Figures

Fig. 1.
Fig. 1.
Analysis of the rat and gerbil Mrg families. (A) Phylogenetic analysis of the rat Mrg family. The program clustalw was used to align rat MRG protein sequences and assemble them into a dendrogram by using the neighbor-joining method. The mouse formyl peptide receptor 1 (mFMLP) was used as the outgroup. Genes that fall into the B2, B4, and B8 subdivisions are bracketed. Ψ, predicted pseudogenes. (B) Southern blot analysis of rodent Mrgs. Each lane contains 9 μgof BglII digested liver genomic DNA from mouse (M), rat (R), or gerbil (G). Blots were probed and washed under high stringency conditions with the designated rat Mrg probes. For all lanes, no bands were visible below 1 kb. (C) Summary of rodent MrgA, MrgB, MrgC, and MrgD subfamilies based on data obtained from Southern blots, degenerate PCR, and genomic analyses. For mouse and rat, the number of bands detected by Southern blotting is similar to the number of genes predicted from the draft genomic sequences.
Fig. 2.
Fig. 2.
Pairwise synonymous (Ks) and nonsynonymous (Ka) nucleotide substitutions per 100 sites between mouse and rat Mrg subfamily members. Each point represents a single pairwise comparison between Mrgs of the mMrgA (green diamonds), mMrgB (dark blue squares), rMrgB (light blue triangles), or mMrgC (red circles) subfamily. The dashed line marks a Ka/Ks ratio of 1.0 or neutral selection. Points below the line are considered to be under negative selection (Ka/Ks ratio <1.0) and points above, under positive selection (Ka/Ks ratio >1.0). The scale at the top of the graph relates Ks values to evolutionary divergence time in MYA. a, The shaded bar marks the approximate time when rats last shared a common ancestor with mice 20–41 MYA (–23). b, The shaded bar indicates the approximate time when gerbils last shared a common ancestor with rats and mice 66 MYA (21, 22). c, The shaded bar indicates the approximate time when rodents and primates last shared a common ancestor 75–115 MYA (–23).
Fig. 3.
Fig. 3.
Correlated expression and chromosomal localization of rodent Mrgs. (A) Expression analysis of rat Mrgs in adult trigeminal ganglia (gV). In situ hybridization was performed with antisense digoxigenin-labeled riboprobes. (B) Chromosomal arrangement of rat and mouse Mrgs. Analyses of the January 21, 2003, assembly of the rat genome and the February 24, 2003 (National Center for Biotechnology Information mouse build 30), assembly of the mouse genome revealed that most of the Mrg family members were located within two discrete regions of rat chromosome 1 and mouse chromosome 7. These two regions encompass the MrgABC cluster (760 kb in size from rat assembly NW_043369; 1.2 Mb in size from mouse assemblies NT_039420-NT_039423) and the MrgDEFG cluster (1.9 Mb in size from rat assemblies NW_043404-NW_043405; 1.6 Mb in size from mouse assembly NT_039437). The circle marks the relative position of the centromere. Triangles denote the direction of transcription and indicate the relative position of each gene on the chromosome. This figure is not drawn to scale. Brackets indicate the location of the three MrgB subdivisions. Several of the mouse A-A-C repeats are also highlighted. The mouse A-C cluster begins with MrgA6 and ends with a misassembled fragment of MrgC11. We did not plot all of the mMrgA and mMrgC genes because of obvious inaccuracies in the mouse assembly.
Fig. 4.
Fig. 4.
Analysis of Mrg expression in adult rat and mouse DRG neurons. (A) Coexpression of rat Mrgs with various sensory neuron markers. With the exception of IB4, all gene combinations were detected by double-label in situ hybridization (ISH) with the indicated antisense cRNA probe. Fluorescein-conjugated G. simplicifolia IB4-lectin was applied to sections after the ISH procedure to detect IB4-binding cells. (B) Summary of the rat and mouse Mrg expression domains in adult DRG sensory neurons. The sizes of the circles in the Venn diagrams are proportional to the sizes of the cell populations. Our results of double-label ISH among mMrgAs, mMrgB4, mMrgC11, mMrgD, and several nociceptive sensory neuron markers are also indicated (11, 13).
Fig. 5.
Fig. 5.
Possible mechanisms for Mrg expansion. (A) Idealized mechanism for the expansion of the mouse MrgA and MrgC (-A-C-) gene cluster. First, an L1 retrotransposon inserts into the 3′ end of the ancestral murine MrgA gene (L1*). At a later date, an unequal crossover event occurs between this new L1* and preexisting intergenic L1 sequences, creating the initial (A-A-C) repeat. Last, additional rounds of unequal crossover take place due to the large amount of homologous L1 sequence in the local genomic environment. (B)An unequal crossover event could explain why rodent and primate Mrg families are related but not orthologous. Assume that the common ancestor of primates and rodents contained single MrgX and MrgB genes. Unequal crossover could resolve into -X-B-B- and -X-containing chromosomes. In the rodent lineage, the -X-gene may have evolved into MrgA and MrgC genes, because they appear to be more closely related to human MrgXs than to rodent MrgBs (Fig. 6 and ref. 11). In humans, the -X-gene likely underwent additional rounds of unequal crossover to create the clustered MrgX/SNSR subfamily.

Similar articles

Cited by

References

    1. Young, J. M. & Trask, B. J. (2002) Hum. Mol. Genet. 11, 1153–1160. - PubMed
    1. Lindemann, B. (2001) Nature 413, 219–225. - PubMed
    1. Nathans, J. (1999) Neuron 24, 299–312. - PubMed
    1. Wang, Y., Macke, J. P., Merbs, S. L., Zack, D. J., Klaunberg, B., Bennett, J., Gearhart, J. & Nathans, J. (1992) Neuron 9, 429–440. - PubMed
    1. Vassalli, A., Rothman, A., Feinstein, P., Zapotocky, M. & Mombaerts, P. (2002) Neuron 35, 681–696. - PubMed

Publication types

MeSH terms