

Separating pitch chroma and pitch height in the human brain
- PMID: 12909719
- PMCID: PMC187755
- DOI: 10.1073/pnas.1730682100
Separating pitch chroma and pitch height in the human brain
Abstract
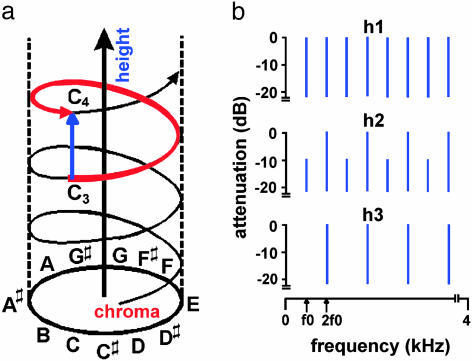
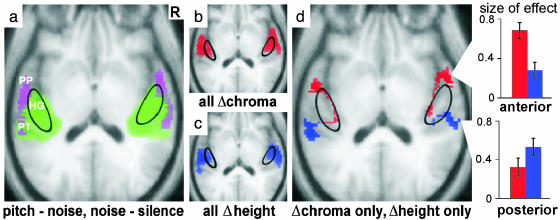
Musicians recognize pitch as having two dimensions. On the keyboard, these are illustrated by the octave and the cycle of notes within the octave. In perception, these dimensions are referred to as pitch height and pitch chroma, respectively. Pitch chroma provides a basis for presenting acoustic patterns (melodies) that do not depend on the particular sound source. In contrast, pitch height provides a basis for segregation of notes into streams to separate sound sources. This paper reports a functional magnetic resonance experiment designed to search for distinct mappings of these two types of pitch change in the human brain. The results show that chroma change is specifically represented anterior to primary auditory cortex, whereas height change is specifically represented posterior to primary auditory cortex. We propose that tracking of acoustic information streams occurs in anterior auditory areas, whereas the segregation of sound objects (a crucial aspect of auditory scene analysis) depends on posterior areas.
Figures
Similar articles
-
Analyzing pitch chroma and pitch height in the human brain.Ann N Y Acad Sci. 2003 Nov;999:212-4. doi: 10.1196/annals.1284.032. Ann N Y Acad Sci. 2003. PMID: 14681144
-
Evidence for pitch chroma mapping in human auditory cortex.Cereb Cortex. 2013 Nov;23(11):2601-10. doi: 10.1093/cercor/bhs242. Epub 2012 Aug 23. Cereb Cortex. 2013. PMID: 22918980 Free PMC article.
-
Evidence for Linear but Not Helical Automatic Representation of Pitch in the Human Auditory System.J Cogn Neurosci. 2019 May;31(5):669-685. doi: 10.1162/jocn_a_01374. Epub 2019 Jan 18. J Cogn Neurosci. 2019. PMID: 30657000
-
Sensitivity and selectivity of neurons in auditory cortex to the pitch, timbre, and location of sounds.Neuroscientist. 2010 Aug;16(4):453-69. doi: 10.1177/1073858410371009. Epub 2010 Jun 7. Neuroscientist. 2010. PMID: 20530254 Review.
-
Cortical representations of pitch in monkeys and humans.Curr Opin Neurobiol. 2006 Aug;16(4):391-9. doi: 10.1016/j.conb.2006.07.001. Epub 2006 Jul 13. Curr Opin Neurobiol. 2006. PMID: 16842992 Free PMC article. Review.
Cited by
-
Pitch perception.J Neurosci. 2012 Sep 26;32(39):13335-8. doi: 10.1523/JNEUROSCI.3815-12.2012. J Neurosci. 2012. PMID: 23015422 Free PMC article.
-
Dynamics of Pitch Perception in the Auditory Cortex.J Neurosci. 2025 Mar 19;45(12):e1111242025. doi: 10.1523/JNEUROSCI.1111-24.2025. J Neurosci. 2025. PMID: 39909567
-
Toward a quantitative account of pitch distribution in spontaneous narrative: method and validation.J Acoust Soc Am. 2013 May;133(5):2953-71. doi: 10.1121/1.4796111. J Acoust Soc Am. 2013. PMID: 23654400 Free PMC article.
-
Pitch processing sites in the human auditory brain.Cereb Cortex. 2009 Mar;19(3):576-85. doi: 10.1093/cercor/bhn108. Epub 2008 Jul 4. Cereb Cortex. 2009. PMID: 18603609 Free PMC article.
-
Audio-visual perception of 3D cinematography: an fMRI study using condition-based and computation-based analyses.PLoS One. 2013 Oct 23;8(10):e76003. doi: 10.1371/journal.pone.0076003. eCollection 2013. PLoS One. 2013. PMID: 24194828 Free PMC article.
References
-
- American Standards Association (1960) Acoustical Terminology S1 (American Standards Assoc., New York).
-
- Donkin, F. (1874) Acoustics (Oxford Univ. Press, Oxford, U.K.).
-
- Pikler, A. (1966) J. Acoust. Soc. Am. 39, 1102–1110.
-
- Shepard, R. N. (1982) in The Psychology of Music, ed. Deutsch, D. (Academic, New York), 1st Ed., pp. 344–390.
-
- Krumhansl, C. L. (1990) in Cognitive Foundations of Musical Pitch (Oxford Univ. Press, New York), pp. 112–114.
Publication types
MeSH terms
LinkOut - more resources
Full Text Sources
Other Literature Sources
