

Crystal structure and functional analysis of Escherichia coli glutamate decarboxylase
- PMID: 12912902
- PMCID: PMC175793
- DOI: 10.1093/emboj/cdg403
Crystal structure and functional analysis of Escherichia coli glutamate decarboxylase
Abstract
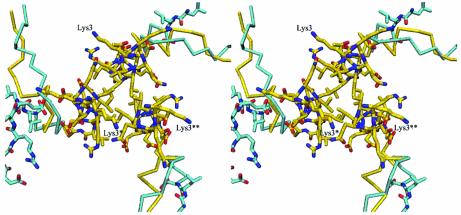
Glutamate decarboxylase is a vitamin B6-dependent enzyme, which catalyses the decarboxylation of glutamate to gamma-aminobutyrate. In Escherichia coli, expression of glutamate decarboxylase (GadB), a 330 kDa hexamer, is induced to maintain the physiological pH under acidic conditions, like those of the passage through the stomach en route to the intestine. GadB, together with the antiporter GadC, constitutes the gad acid resistance system, which confers the ability for bacterial survival for at least 2 h in a strongly acidic environment. GadB undergoes a pH-dependent conformational change and exhibits an activity optimum at low pH. We determined the crystal structures of GadB at acidic and neutral pH. They reveal the molecular details of the conformational change and the structural basis for the acidic pH optimum. We demonstrate that the enzyme is localized exclusively in the cytoplasm at neutral pH, but is recruited to the membrane when the pH falls. We show by structure-based site-directed mutagenesis that the triple helix bundle formed by the N-termini of the protein at acidic pH is the major determinant for this behaviour.
Figures


Similar articles
-
Thermostabilization of glutamate decarboxylase B from Escherichia coli by structure-guided design of its pH-responsive N-terminal interdomain.J Biotechnol. 2014 Mar 20;174:22-8. doi: 10.1016/j.jbiotec.2014.01.020. Epub 2014 Jan 27. J Biotechnol. 2014. PMID: 24480573
-
Mutation of His465 alters the pH-dependent spectroscopic properties of Escherichia coli glutamate decarboxylase and broadens the range of its activity toward more alkaline pH.J Biol Chem. 2009 Nov 13;284(46):31587-96. doi: 10.1074/jbc.M109.049577. Epub 2009 Sep 21. J Biol Chem. 2009. PMID: 19797049 Free PMC article.
-
Control of acid resistance in Escherichia coli.J Bacteriol. 1999 Jun;181(11):3525-35. doi: 10.1128/JB.181.11.3525-3535.1999. J Bacteriol. 1999. PMID: 10348866 Free PMC article.
-
Increasing thermal stability of glutamate decarboxylase from Escherichia. coli by site-directed saturation mutagenesis and its application in GABA production.J Biotechnol. 2018 Jul 20;278:1-9. doi: 10.1016/j.jbiotec.2018.04.009. Epub 2018 Apr 13. J Biotechnol. 2018. PMID: 29660473
-
The response to stationary-phase stress conditions in Escherichia coli: role and regulation of the glutamic acid decarboxylase system.Mol Microbiol. 1999 Jun;32(6):1198-211. doi: 10.1046/j.1365-2958.1999.01430.x. Mol Microbiol. 1999. PMID: 10383761
Cited by
-
Multitier regulation of the E. coli extreme acid stress response by CsrA.J Bacteriol. 2024 Apr 18;206(4):e0035423. doi: 10.1128/jb.00354-23. Epub 2024 Feb 6. J Bacteriol. 2024. PMID: 38319100 Free PMC article.
-
Biochemical and spectroscopic properties of Brucella microti glutamate decarboxylase, a key component of the glutamate-dependent acid resistance system.FEBS Open Bio. 2015 Mar 17;5:209-18. doi: 10.1016/j.fob.2015.03.006. eCollection 2015. FEBS Open Bio. 2015. PMID: 25853037 Free PMC article.
-
Unraveling the Potential of γ-Aminobutyric Acid: Insights into Its Biosynthesis and Biotechnological Applications.Nutrients. 2024 Aug 19;16(16):2760. doi: 10.3390/nu16162760. Nutrients. 2024. PMID: 39203897 Free PMC article. Review.
-
The yhiM gene codes for an inner membrane protein involved in GABA export in Escherichia coli.AIMS Microbiol. 2017 Feb 17;3(1):71-87. doi: 10.3934/microbiol.2017.1.71. eCollection 2017. AIMS Microbiol. 2017. PMID: 31294150 Free PMC article.
-
PLP-dependent enzymes as entry and exit gates of sphingolipid metabolism.Protein Sci. 2011 Sep;20(9):1492-508. doi: 10.1002/pro.679. Protein Sci. 2011. PMID: 21710479 Free PMC article. Review.
References
-
- Blattner F.R. et al. (1997) The complete genome sequence of Escherichia coli K-12. Science, 277, 1453–1474. - PubMed
-
- Booth I.R. (1999) The regulation of intracellular pH in bacteria. In Derek,J.C. and Gardner,G. (eds), Bacterial Response to pH. John Wiley and Sons, Chichester, UK.
Publication types
MeSH terms
Substances
LinkOut - more resources
Full Text Sources
Other Literature Sources
Molecular Biology Databases
Research Materials
