. 2003 Aug 15;22(16):4103-10.
doi: 10.1093/emboj/cdg412.

A signalling role for 4-hydroxy-2-nonenal in regulation of mitochondrial uncoupling

Affiliations

A signalling role for 4-hydroxy-2-nonenal in regulation of mitochondrial uncoupling

Karim S Echtay et al. EMBO J. .

Abstract

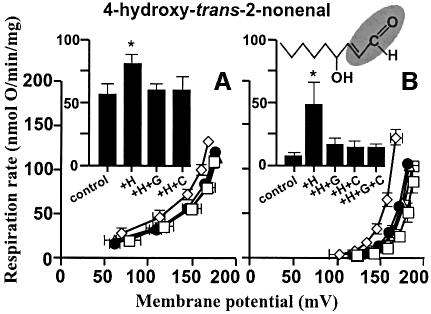
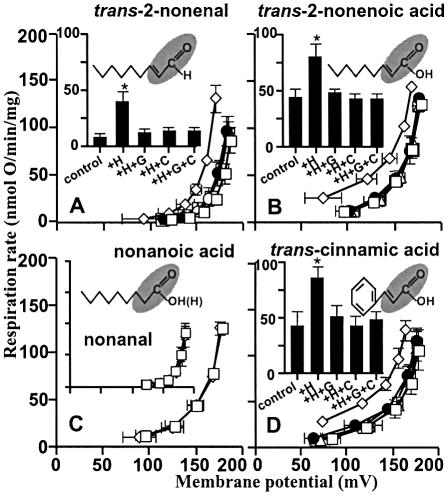
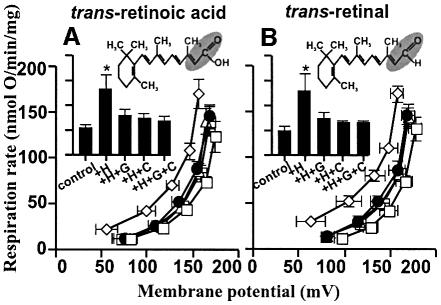
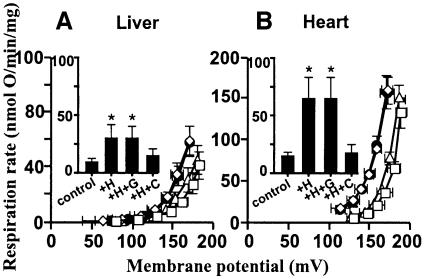
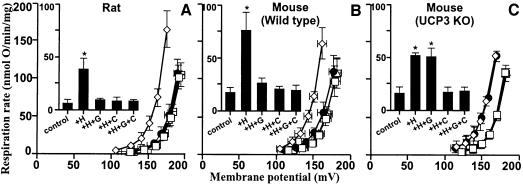
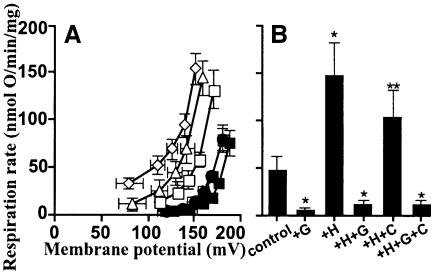
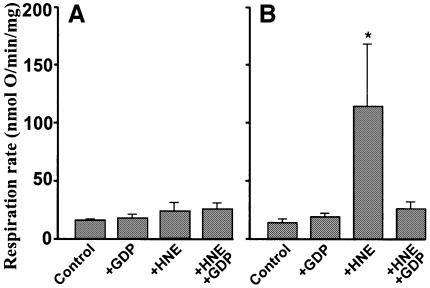
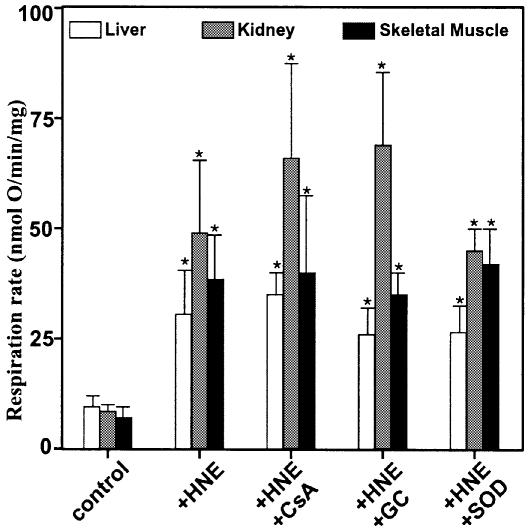
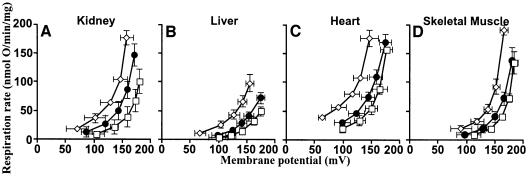
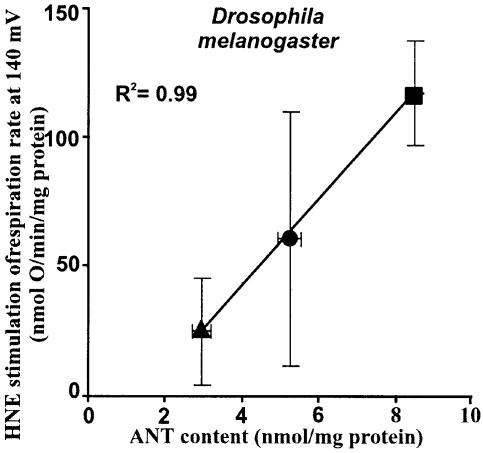
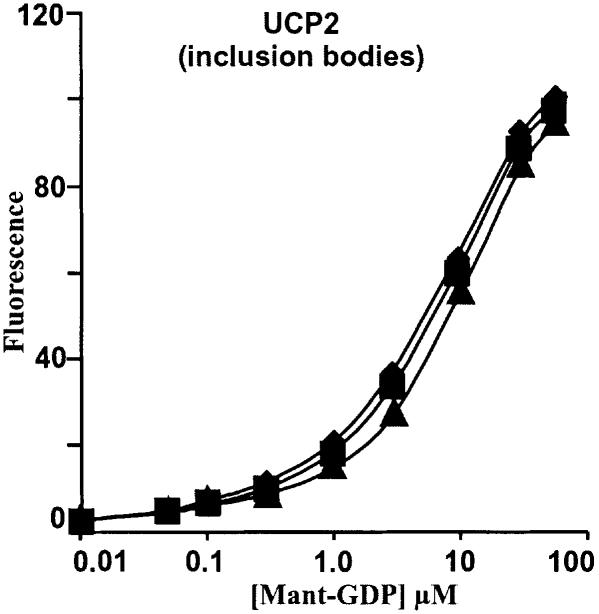
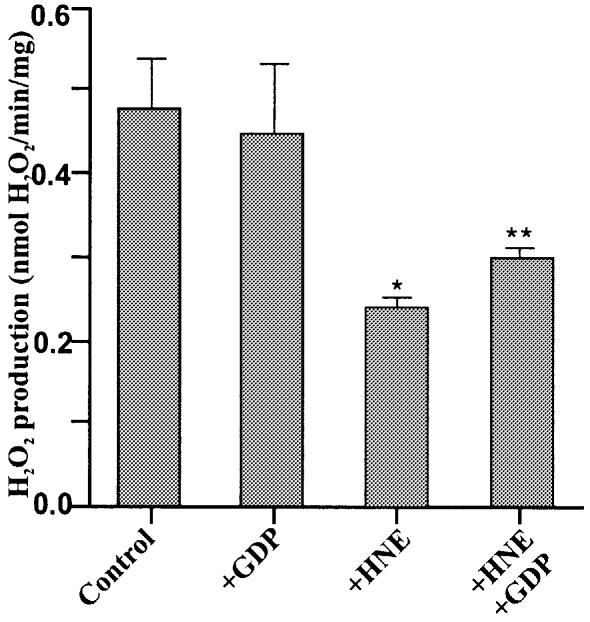
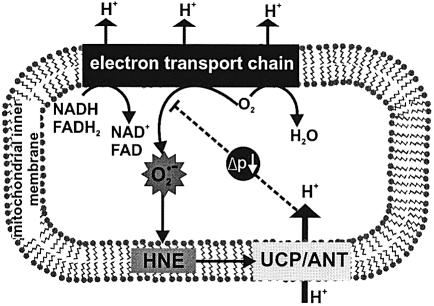
Oxidative stress and mitochondrial dysfunction are associated with disease and aging. Oxidative stress results from overproduction of reactive oxygen species (ROS), often leading to peroxidation of membrane phospholipids and production of reactive aldehydes, particularly 4-hydroxy-2-nonenal. Mild uncoupling of oxidative phosphorylation protects by decreasing mitochondrial ROS production. We find that hydroxynonenal and structurally related compounds (such as trans-retinoic acid, trans-retinal and other 2-alkenals) specifically induce uncoupling of mitochondria through the uncoupling proteins UCP1, UCP2 and UCP3 and the adenine nucleotide translocase (ANT). Hydroxynonenal-induced uncoupling was inhibited by potent inhibitors of ANT (carboxyatractylate and bongkrekate) and UCP (GDP). The GDP-sensitive proton conductance induced by hydroxynonenal correlated with tissue expression of UCPs, appeared in yeast mitochondria expressing UCP1 and was absent in skeletal muscle mitochondria from UCP3 knockout mice. The carboxyatractylate-sensitive hydroxynonenal stimulation correlated with ANT content in mitochondria from Drosophila melanogaster expressing different amounts of ANT. Our findings indicate that hydroxynonenal is not merely toxic, but may be a biological signal to induce uncoupling through UCPs and ANT and thus decrease mitochondrial ROS production.


Figures

None
Fig. 1. Hydroxynonenal activation of proton conductance through UCP2 and ANT: effect of HNE on proton leak kinetics in rat kidney mitochondria. Proton leak kinetics were measured as described in Materials and methods: (A) without BSA in the presence of 1 µM HNE; (B) in the presence of BSA and 35 µM HNE. Squares, control; diamonds, HNE (+H); filled circles, HNE plus 500 µM GDP (+H+G); triangles, HNE plus 2.5 µM CAT (+H+C); crossed squares, HNE plus GDP and CAT (+H+G+C). Inserts show respiration rates driving proton leak at 150 mV for the same dataset. Data are means ± SEM of three independent experiments each performed in duplicate. *P <0.05 versus control.
None
Fig. 2. Hydroxynonenal activation of proton conductance through UCP2 and ANT: effects of compounds related to HNE on proton leak kinetics in rat kidney mitochondria. Proton leak kinetics were measured as described in Materials and methods in the presence of: (A) BSA and 35 µM trans-2-nonenal; (B) 35 µM trans-2-nonenoic acid; (C) 35 µM nonanoic acid (insert: BSA and 35 µM nonanal); (D) 50 µM cinnamic acid. Squares, control; diamonds, studied compound (+H); filled circles, compound plus 500 µM GDP (+H+G); triangles, compound plus 2.5 µM CAT (+H+C); crossed squares, compound plus GDP and CAT (+H+G+C). Inserts in (A), (B) and (D) show respiration rates driving proton leak at 150 mV for the same dataset. Data are means ± SEM of three independent experiments each performed in duplicate. *P <0.05 versus control.
None
Fig. 3. Hydroxynonenal activation of proton conductance through UCP2 and ANT: effects of retinoic acid and retinal on proton leak kinetics in rat kidney mitochondria. Proton leak kinetics were measured as described in Materials and methods in the presence of: (A) 5 µM trans-retinoic acid; (B) 5 µM trans-retinal. Squares, control; diamonds, studied compound (+H); filled circles, compound plus 500 µM GDP (+H+G); triangles, compound plus 2.5 µM CAT (+H+C); crossed squares, compound plus GDP and CAT (+H+G+C). Inserts show respiration rates driving proton leak at 150 mV for the same dataset. Data are means ± SEM of three independent experiments each performed in duplicate. *P <0.05 versus control.
None
Fig. 4. Effect of hydroxynonenal on mitochondrial proton conductance through ANT. Proton leak kinetics in mitochondria from (A) liver and (B) heart were measured as described in Materials and methods in the presence of BSA. Squares, control; diamonds, plus 35 µM HNE (+H); filled circles, HNE plus 500 µM GDP (+H+G); triangles, HNE plus 2.5 µM CAT (+H+C). Inserts show respiration rates driving proton leak at 150 mV for the same dataset. Data are means ± SEM of three independent experiments each performed in duplicate. *P <0.05 versus control.
None
Fig. 5. Hydroxynonenal activation of proton conductance through UCP3 and ANT. Proton leak kinetics were measured as described in Materials and methods in the presence of BSA in mitochondria from: (A) rat skeletal muscle; (B) skeletal muscle from wild-type mice; (C) skeletal muscle from ucp3–/– mice (Echtay et al., 2002a). Squares, control; diamonds, 35 µM HNE (+H); filled circles, HNE plus 500 µM GDP (+H+G); triangles, HNE plus 2.5 µM CAT (+H+C). Inserts show respiration rates driving proton leak at 150 mV for the same dataset. Data are means ± SEM of three independent experiments each performed in duplicate. *P <0.05 versus control.
None
Fig. 6. Hydroxynonenal activation of proton conductance through UCP1 and ANT in BAT mitochondria. Proton leak kinetics were measured as described in Materials and methods in the presence of BSA (1%) in mitochondria from warm-adapted rat BAT. (A) Leak kinetics: squares, control; filled squares, control plus 500 µM GDP (+G); diamonds, 50 µM HNE (+H); filled circles, HNE plus 500 µM GDP (+H+G); triangles, HNE plus 2.5 µM CAT (+H+C); crossed squares, HNE plus GDP and CAT (+H+G+C). (B) Respiration rates driving proton leak at 150 mV for the same dataset. Data are means ± SEM of three independent experiments each performed in duplicate. *P <0.05 versus control; **P <0.05 versus +H.
None
Fig. 7. Hydroxynonenal activation of proton conductance through mouse UCP1 expressed in yeast mitochondria. Proton leak kinetics were measured as described in Materials and methods in mitochondria from: (A) yeast containing control empty vector; (B) yeast expressing mouse UCP1. Respiration rates driving proton leak were interpolated from the leak kinetics at 82 mV. Data are means ± SEM of three independent experiments each performed in duplicate. * P <0.05 versus control.
None
Fig. 8. Hydroxynonenal activation of proton leak. Mitochondria from rat liver, kidney, and skeletal muscle were incubated as described in Materials and methods in the presence of BSA. 35 µM HNE, 500 µM GDP, 2.5 µM CAT, 1 µM cyclosporin A (CSA), 1 µM glybenclamide (GC) and 12 U.ml–1 superoxide dismutase (SOD) were present where indicated. Respiration rates driving proton leak were interpolated from the leak kinetics at 150 mV. Data are means ± SEM of three independent experiments each performed in duplicate. *P <0.05 versus control.
None
Fig. 9. Hydroxynonenal activation of proton conductance through ANT: effect of BKA. Mitochondria from different rat tissues were incubated as described in Materials and methods without BSA. (A) Kidney; (B) liver; (C) heart; (D) skeletal muscle. Squares, control; diamonds, plus 35 µM HNE; filled circles, HNE plus 8 µM BKA. Data are means ± SEM of three independent experiments each performed in duplicate.
None
Fig. 10. Dependence of hydroxynonenal activation on ANT content in Drosophila mitochondria. Proton leak was measured as described in Materials and methods with 2 mM MgCl2 and 0.3% (w/v) BSA present, at 25°C, using 10 mM glycerol 3-phosphate as substrate and titrating with cyanide up to ∼200 µM. The stimulation of respiration by 35 µM HNE was interpolated from the leak kinetics at the highest common potential (140 mV). ANT content was measured by titration with CAT. Circle, wild-type flies; triangle, sesB+/– flies (sesB codes for ANT; Zhang et al., 1999); square, flies with a 10.3 kb fragment containing sesB inserted into chromosome 2 or 4. Data are means ± SEM of six independent experiments each performed in duplicate.
None
Fig. 11. Effect of CAT on nucleotide binding to UCP2. Fluorescence binding measurement of Mant-GDP to renatured UCP2 inclusion bodies was performed as described in Materials and methods. Diamonds, no CAT; squares, plus 1 µM CAT; triangles, plus 10 µM CAT.
None
Fig. 12. Hydroxynonenal decreases mitochondrial ROS production. H2O2 production by kidney mitochondria was measured as described in Materials and methods in the presence of 10 µM HNE and 500 µM GDP as indicated. Data are means ± range of two independent experiments each performed in duplicate. *P <0.05 versus control; **P <0.05 versus +HNE.
None
Fig. 13. Signalling role of hydroxynonenal. During oxidation of substrates, the complexes of the mitochondrial electron transport chain reduce oxygen to water, and pump protons into the intermembrane space, forming a proton motive force (Δp). However, some electrons in the reduced complexes also react with oxygen to produce superoxide. Superoxide can peroxidize membrane phospholipids, forming hydroxynonenal, which induces proton transport through UCPs and ANT. The mild uncoupling caused by proton transport lowers Δp and slightly stimulates electron transport, causing the complexes to become more oxidized and lowering the local concentration of oxygen; both these effects decrease superoxide production. Thus induction of proton leak by hydroxynonenal limits mitochondrial ROS production as a feedback response to overproduction of superoxide by the respiratory chain.

Similar articles

Cited by

References

    1. Alvarez R., de Andres,J., Yubero,P., Vinas,O., Mampel,T., Iglesias,R., Giralt,M. and Villarroya,F. (1995) A novel regulatory pathway of brown fat thermogenesis. Retinoic acid is a transcriptional activator of the mitochondrial uncoupling protein gene. J. Biol. Chem., 270, 5666–5673. - PubMed
    1. Boss O., Samec,S., Paoloni-Giacobino,A., Rossier,C., Dulloo,A., Seydoux,J., Muzzin,P. and Giacobino,J.-P. (1997) Uncoupling protein-3: a new member of the mitochondrial carrier family with tissue-specific expression. FEBS Lett., 408, 39–42. - PubMed
    1. Bouillaud F., Couplan,E., Pecqueur,C. and Ricquier,D. (2001) Homologues of the uncoupling protein from brown adipose tissue (UCP1): UCP2, UCP3, BMCP1 and UCP4. Biochim. Biophys. Acta, 1504, 107–119. - PubMed
    1. Brand M.D. (1995) Measurement of mitochondrial protonmotive force. In Brown,G.C. and Cooper,C.E. (eds), Bioenergetics—A Practical Approach. IRL Press, Oxford, UK, pp. 39–62.
    1. Brand M.D., Pamplona,R., Portero-Otin,M., Requena,J.R., Roebuck,S.J., Buckingham,J.A., Clapham,J.C. and Cadenas,S. (2002) Oxidative damage and phospholipid fatty acyl composition in skeletal muscle mitochondria from mice underexpressing or overexpressing uncoupling protein 3. Biochem. J., 368, 597–603. - PMC - PubMed

MeSH terms

LinkOut - more resources