. 2003 Aug 15;22(16):4190-201.
doi: 10.1093/emboj/cdg413.

The in vivo roles of STEF/Tiam1, Rac1 and JNK in cortical neuronal migration

Affiliations

The in vivo roles of STEF/Tiam1, Rac1 and JNK in cortical neuronal migration

Takeshi Kawauchi et al. EMBO J. .

Abstract

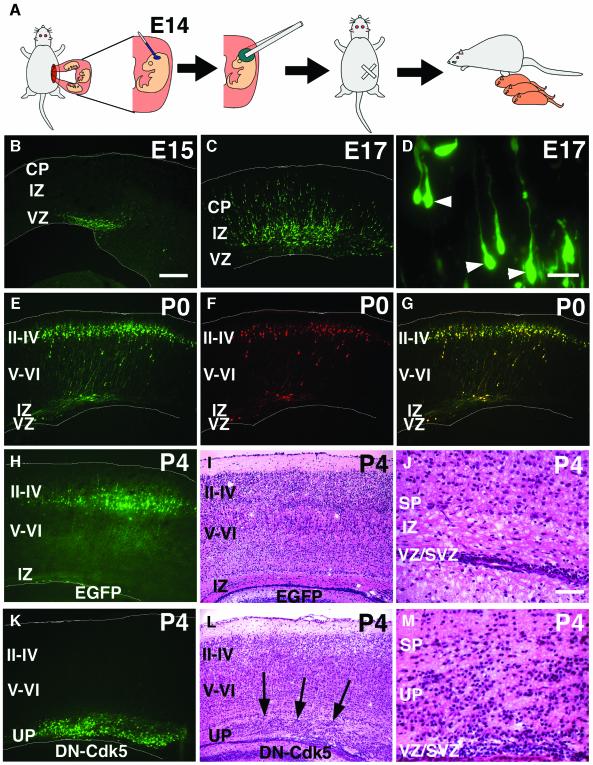
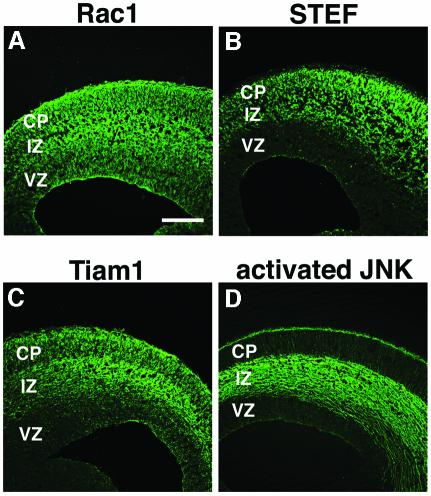
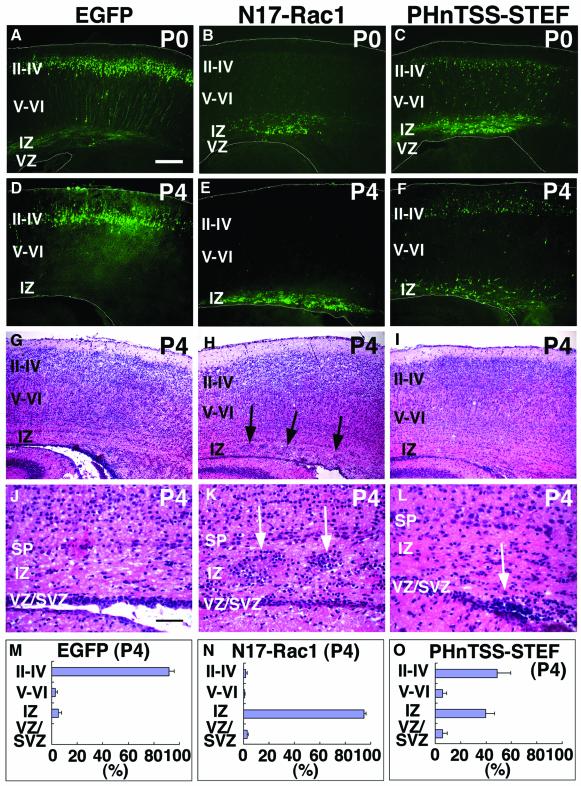
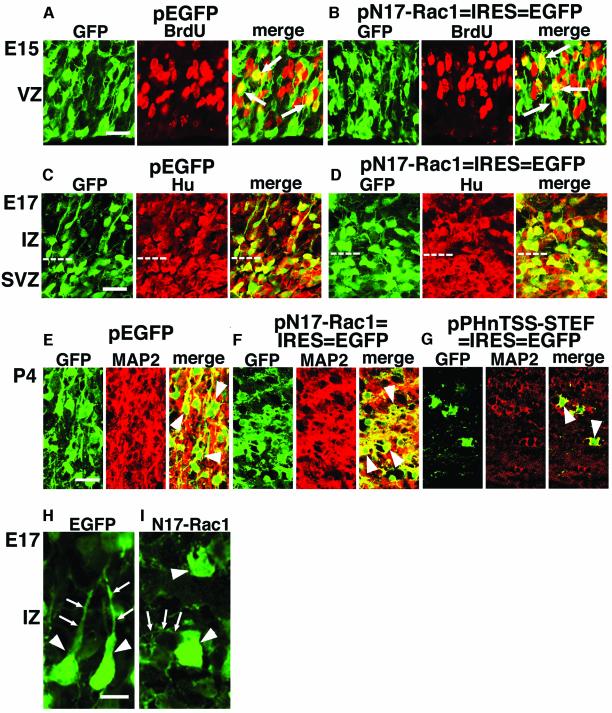
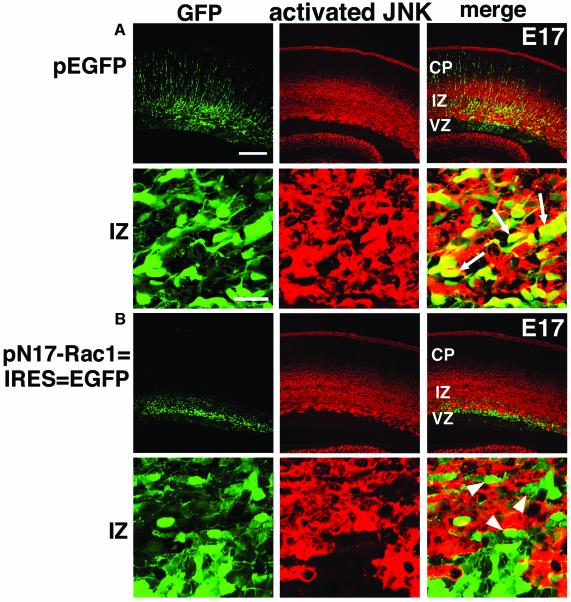
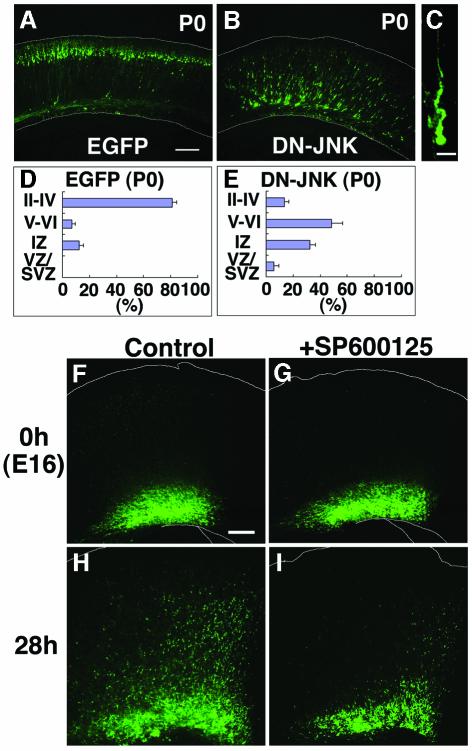
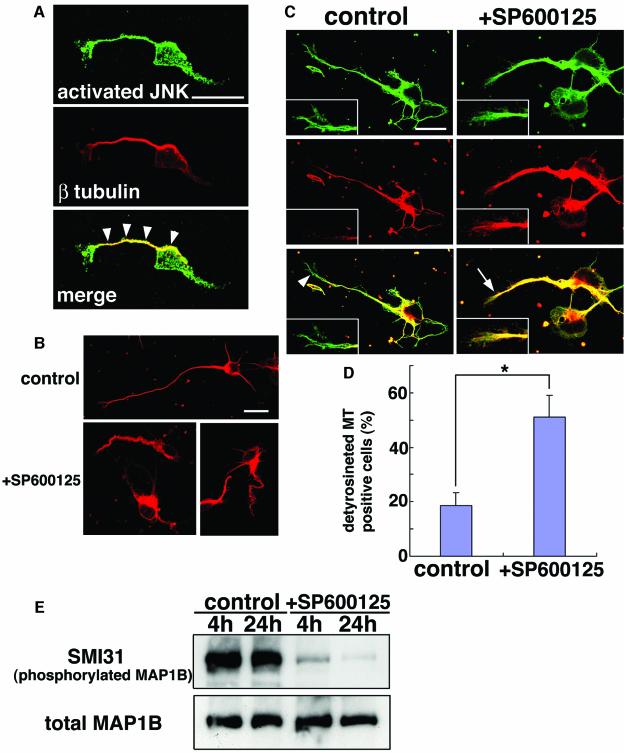
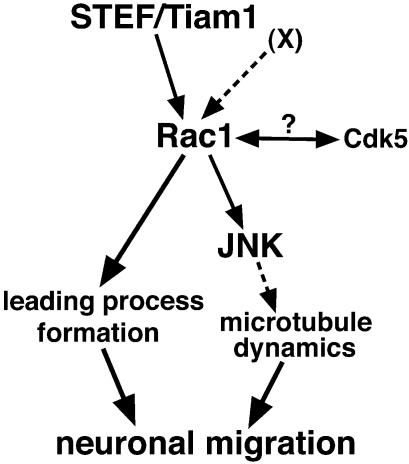
The coordinated migration of neurons is a pivotal step for functional architectural formation of the mammalian brain. To elucidate its molecular mechanism, gene transfer by means of in utero electroporation was applied in the developing murine brain, revealing the crucial roles of Rac1, its activators, STEF/Tiam1, and its downstream molecule, c-Jun N-terminal kinase (JNK), in the cerebral cortex. Functional repression of these molecules resulted in inhibition of radial migration of neurons without affecting their proper differentiation. Interestingly, distinct morphological phenotypes were observed; suppression of Rac1 activity caused loss of the leading process, whereas repression of JNK activity did not, suggesting the complexity of the signaling cascade. In cultured neurons from the intermediate zone, activated JNK was detected along microtubules in the processes. Application of a JNK inhibitor caused irregular morphology and increased stable microtubules in processes, and decreased phosphorylation of microtubule associated protein 1B, raising a possibility of the involvement of JNK in controlling tubulin dynamics in migrating neurons. Our data thus provide important clues for understanding the intracellullar signaling machinery for cortical neuronal migration.


Figures

None
Fig. 1. In utero electroporation. (A) Schematic of in utero electroporation (see Materials and methods). (BMIn utero electroporation of pEGFP (B–D, H–J), pEGFP plus pDsRed (E–G) or pDN-Cdk5–IRES–EGFP (K–M) into VZ cells of the cerebral cortex. Animals were killed at E15 (B), E17 (C and D), P0 (E–G) and P4 (H–M). EGFP or DsRed fluorescence was viewed in fixed coronal sections. Normal development of VZ cells and their progeny are not affected (B–J). (D) A higher magnification of (C). (E–G) Simultaneous electroporation of pEGFP [(E), green] and pDsRed [(F), red] showed high efficiency of co-expression [(G), merged]. (H–M) Introduction of DN-Cdk5 abolished normal neuronal migration (K–M), mimicking the phenotype of Cdk5-deficient mice, in contrast to controls (H–J). (I and L) HE staining of the sections in (H) and (K), respectively. (J) and (M) are higher magnifications of (I) and (L), around the IZ, respectively. Underplate-like structure (UP) (Gilmore et al., 1998) was observed in DN-Cdk5 transfected animals [arrows in (L)]. White lines in (B), (C), (E)–(H) and (K) represent pial and ventricular surfaces. CP, cortical plate; IZ, intermediate zone; VZ, ventricular zone; SVZ, subventricular zone; II–IV, layers II–IV of the CP; V–VI, layers V and VI of the CP; SP, subplate. Scale bars: 200 µm in (B), (C), (E)–(I), (K) and (L); 10 µm in (D); 50 µm in (J) and (M).
None
Fig. 2. Distribution patterns of Rac1 (A), STEF (B), Tiam1 (C) and activated JNK (D) in the cerebral cortex of E15 embryos visualized by specific antibodies. Scale bar, 200 µm.
None
Fig. 3. DN effects of Rac1 and STEF/Tiam1 on the developing cerebral cortex. pEGFP (A, D, G, J and M), pN17-Rac1–IRES–EGFP (B, E, H, K and N) or pPHnTSS-STEF–IRES–EGFP (C, F, I, L and O) was introduced into E14 VZ cells. At P0 (A–C) or P4 (D–O), frozen brain sections were examined for EGFP fluorescence (AF). White lines in (A)–(F) represent pial and ventricular surfaces. After EGFP signals of P4 samples (D–F) were recorded, sections were subjected to HE staining (GL). (J–L) Higher magnifications of (G)–(I), around the IZ, respectively. Arrows indicate abnormal accumulation of cells in the IZ of N17-Rac1 or PHnTSS-STEF electroporated brains, respectively. Most of these cells were found to be EGFP positive. Each DN form used in this experiment (N17-Rac1, PHnTSS STEF) contains an epitope tag. By immunostaining, expression of each DN form was confirmed in EGFP-positive cells (data not shown). (MO) Mice subjected to electroporation were killed at P4 to estimate the extent of migration by recording fluorescence intensities of EGFP in distinct parts of the cerebral cortex; layers II–IV, layers V–VI, IZ and VZ/SVZ. Each score represents mean percentage of relative intensity ± SE. (M) n = 5; (N) n = 7; (O) n = 8. Scale bars: 200 µm in (A)–(I); 50 µm in (J)–(L).
None
Fig. 4. N17-Rac1 did not affect cell division in VZ cells nor differentiation of their progenies. (A and B) BrdU incorporation in VZ cells in animals electroporated with pEGFP (A) or pN17-Rac1–IRES–EGFP (B). Twenty-four hours after electroporation to E14 embryos, BrdU was intraperitoneally administered to the animals for 1 h and animals were killed immediately afterwards. Frozen sections of brains were immunostained with anti-GFP (green) and anti-BrdU (red) antibodies. Arrows indicate cells co-stained with both antibodies. BrdU incorporation rates (BrdU+ cells/EGFP+ cells) in VZ were 27.0 ± 2.2% in (A) and 25.8 ± 1.6% in (B). Scale bar, 20 µm. (C and D) Expression of an early neuronal marker, Hu. E14 embryos were electroporated with the indicated plasmids and killed at E17. Frozen sections were immunostained with anti-GFP (green) and anti-Hu (red) antibodies. White dotted lines represent the boundary of IZ and SVZ. Scale bar, 20 µm. (EG) Expression of MAP2. E14 embryos were electroporated and killed at P4. Frozen sections were immunostained with anti-GFP (green) and anti-MAP2 (red) antibodies. (E) shows the region around the CP, and (F) and (G) show the region around the IZ. Arrowheads indicate cells co-expressing the transgene and MAP2. Ectopically located cells differentiated to MAP2-positive neurons, although it could not be determined whether these neurons maintained their original layer specificity. Scale bar, 20 µm. (H and I) Morphology of EGFP-positive cells in IZ of E17 brains electroporated with pEGFP or pN17-Rac1–IRES–EGFP at E14. Cells were stained with anti-EGFP antibody to observe detailed morphology. While control cells [arrowheads in (H)] exhibited a spindle-like morphology with a leading process [arrows in (H)] toward the pial surface, N17-Rac1-expressing cells [arrowheads in (I)] showed a round morphology with minor randomly directed processes [arrows in (I)]. Scale bar, 10 µm.
None
Fig. 5. JNK is activated in migrating neurons in the IZ in a Rac1-dependent manner. (A and B) N17-Rac1 suppresses the activation of JNK in the developing cerebral cortex. E14 brains were electroporated with pEGFP (A) or pN17-Rac1–IRES–EGFP (B) and analyzed at E17. Frozen sections were immunostained with anti-EGFP (green) and anti-activated JNK (red) antibodies. Lower panels are higher magnifications of upper panels. Activated JNK was observed in many control pEGFP-transfected cells [arrows in (A)], but rarely in N17-Rac1 expressing cells in IZ [arrowheads in (B)]. To explain this phenomenon, there exists the possibility that the N17-Rac1-expressing cells are undergoing normal differentiation in an ectopic site (the IZ), rather than N17-Rac1 preventing JNK activation. However, this seemed unlikely because these N17-Rac1-expressing cells were not MAP2-positive at this stage (data not shown). Scale bars: 200 µm in upper panels; 20 µm in lower panels.
None
Fig. 6. Involvement of JNK in migrating neurons. (AE) Effects of DN-JNK on cortical neuronal migration. E14 brains were electroporated with pEGFP (A and D) or pDN-JNK plus pEGFP (B, C and E) and analyzed at P0 by fluorescence microscopy. (C) A high magnification of (B), an IZ cell. DN-JNK expression was confirmed in EGFP-positive cells by anti-epitope immunostaining (data not shown). Scale bars: 200 µm in (A) and (B); 10 µm in (C). (D and E) Estimation of neuronal migration in cerebral cortices transfected with indicated plasmids as described in Figure 3. Each score represents the mean percentage of relative intensity ± SE. (D) n = 4; (E) n = 5. Similar results were obtained by introduction of pDN-JNK–IRES–EGFP, which was designed to elicit simultaneous expression of DN-JNK and EGFP (data not shown). (FI) E14 brains were electroporated with pEGFP and sectioned into coronal slices at E16. The slices were cultured on insert membrane for 3 h (F and G) and subjected to an additional 28 h incubation ±SP600125 in the culture media [(H) or (I), respectively]. Addition of SP600125 resulted in suppression of neuronal migration in vitro. Similar results were obtained from four independent experiments.
None
Fig. 7. JNK regulates microtubule dynamics and MAP1B phosphorylation status in cultured neurons. (A) Cells in E15 IZ were dissociated and cultured for 24 h and stained with anti-activated JNK (green) and anti-β-tubulin (red) antibodies. Activated JNK was observed in nuclei, cytoplasm and processes, particularly along microtubules (arrowheads). Scale bars, 16 µm. (B) Influence of the JNK inhibitor on primary cultured cells. E15 cerebral cortices were dissociated and cultured for 24 h and then subjected to additional 24 h incubation ±SP600125 (upper panel or lower panels, respectively). Cells were stained with an anti-β-tubulin antibody (red). Scale bars, 20 µm. (C and D) E15 cerebral cortices were dissociated and cultured for 20 h and then subjected to additional 8 h incubation ±SP600125. Cells were stained with anti-α-tubulin (green) and anti-detyrosinated tubulin (red) antibodies. Insets represent higher magnifications of tips of processes. Detyrosinated microtubules were barely seen at the process tips (arrowhead) in the control cell, but were significantly detected at the distal ends of the microtubules (arrow) in SP600125-treated cells. Scale bars, 16 µm. (D) Ratio of cells whose longest neurites had detyrosinated microtubules at their tips. When the distance between the distal ends of detyrosinated microtubules [red in (C)] and entire microtubules [green in (C)] at the tip of the longest neurite was <5 µm, that cell was counted as a ‘detyrosinated MT-positive cell’. Scores represent mean percentage ± SE; n = 4 brains; *P = 0.012. (E) Influence of SP600125 on the phosphorylation status of MAP1B. Primary culture of E15 cerebral cortex (2DIV) was treated ±SP600125 for the indicated periods and subjected to immunoblot analyses with the indicated antibodies.
None
Fig. 8. The possible Rac1 pathway involved in neuronal migration in vivo (see Discussion). X represents a putative Rac1 GEF(s) other than STEF/Tiam1 involved in neuronal migration.

Similar articles

Cited by

References

    1. Bennett B.L. et al. (2001) SP600125, an anthrapyrazolone inhibitor of Jun N-terminal kinase. Proc. Natl Acad. Sci. USA, 98, 13681–13686. - PMC - PubMed
    1. Bishop A.L. and Hall,A. (2000) Rho GTPases and their effector proteins. Biochem. J., 348, 241–255. - PMC - PubMed
    1. Bulinski J.C. and Gundersen,G.G. (1991) Stabilization of post-translational modification of microtubules during cellular morphogenesis. BioEssays, 13, 285–293. - PubMed
    1. Cheng A., Krueger,B.K. and Bambrick,L.L. (1999) MAP5 expression in proliferating neuroblasts. Brain Res. Dev. Brain Res., 113, 107–113. - PubMed
    1. Derijard B., Hibi,M., Wu,I.H., Barrett,T., Su,B., Deng,T., Karin,M. and Davis,R.J. (1994) JNK1: a protein kinase stimulated by UV light and Ha-Ras that binds and phosphorylates the c-Jun activation domain. Cell, 76, 1025–1037. - PubMed

Publication types

MeSH terms

Substances