

doi: 10.1073/pnas.1233768100.
Epub 2003 Aug 11.
Coexistence of periodic modulation of quasiparticle states and superconductivity in Bi2Sr2CaCu2O8+delta
Affiliations
- PMID: 12913127
- PMCID: PMC187829
- DOI: 10.1073/pnas.1233768100
Item in Clipboard
Coexistence of periodic modulation of quasiparticle states and superconductivity in Bi2Sr2CaCu2O8+delta
Proc Natl Acad Sci U S A.
.
Abstract
In this article we show, using scanning tunneling spectroscopy, the existence of static striped density of electronic states in nearly optimally doped Bi2Sr2CaCu2O8+delta in zero field. This modulation is aligned with the Cu-O bonds, with a periodicity of four lattice constants, and exhibits features characteristic of a two-dimensional system of line objects. We further show that the density of states modulation manifests itself as a shift of states from above to below the superconducting gap. The fact that a single energy scale (i.e., the gap) appears for both superconductivity and stripes suggests that these two effects have the same origin.
Figures

(a) Topography (160 × 160 Å) of the cleaved BiO
surface (spatial units are in angstroms throughout). The height is a contour
of constant current, or integrated DOS up to the setpoint voltage. The nearly
vertical streaks are the superstructural modulation. Also visible are the Bi
atoms as well as irregular variations that are probably due to changes in the
LDOS (17), not actual height
variation. (b) The superconducting gap magnitude over the same area
as measured by the voltage of the maximum in differential conductance
(dI/dV). (c) Differential conductance as a function
of voltage along the diagonal of a and b (from lower left to
upper right). Each spectrum is colored according to its measured gap magnitude
by using the same color scale as shown in b.
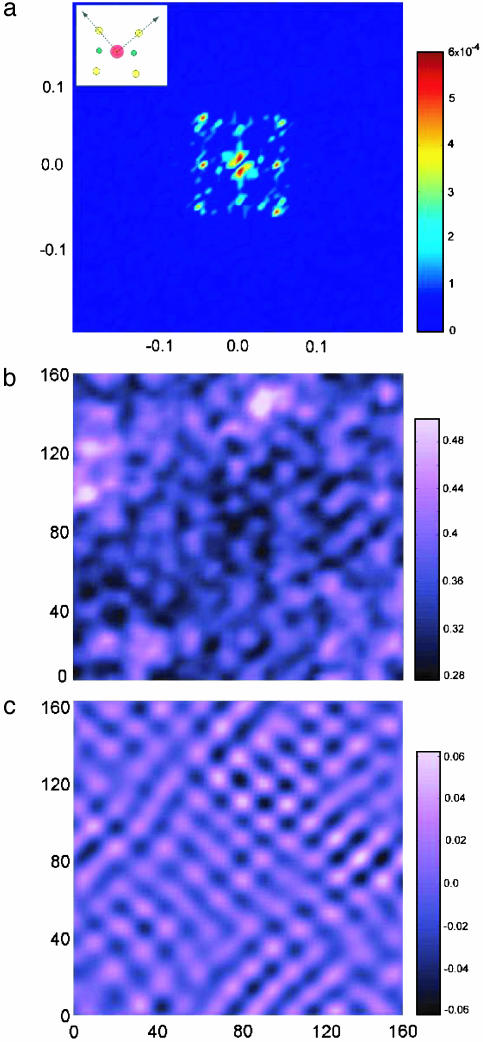
Periodic spatial variation in the quasiparticle DOS. (a) Power
spectrum of the Fourier transform of (dI/dV)(15
mV) fora64 × 64-pixel region. The units are inverse angstroms.
(Inset) Schematic of the features in the power spectrum; the arrows
show the Cu-O-Cu directions. The central red dot corresponds to the signal at
small wavevectors that comes from the randomly distributed inhomogeneities
shown in Fig. 1 b and
c. The horizontal points, which are green in
Inset, correspond to the superstructure. The four diagonal points,
yellow in Inset, show a DOS modulation at k =
(2π/4a0)(0, ±1) and
(2π/4a0)(±1, 0). (b) Map of
(dI/dV)(15 mV) smoothed by averaging neighboring
pixels to remove atomic-scale variations. (c) The data in b
filtered to accentuate the periodic modulation (see text.)

Energy dependence of the periodic LDOS modulation. Plot of the Fourier
transform at k = (2π/4a0)(0, ±1) and k
= (2π/4a0)(± 1,0), the location of the peaks in
Fig. 2a, as a function
of sample bias. The red and blue traces correspond to the real and imaginary
parts, respectively. For each peak, the overall phase used for all energies is
chosen to maximize the real part of the signal. The error bars are determined
by modeling the variations in dI/dV(x, y)
at each energy by uncorrelated noise of the same amplitude.

Spatial variation in the amplitude of the periodic modulation. (a)
Constant current topograph (120 × 120 Å). (b) Power
spectrum of (dI/dV)(15 mV) over the entire (260
× 260-Å) area showing the peaks used in c and d.
Peaks are smaller than those of Fig.
2a because the k-space pixels are smaller and the image
size substantially exceeds the coherence length. (c) Magnitude of the
Fourier transform of (dI/dV)(15 mV) at one of the
(2π/4a0) points for a number of 32 × 32-pixel
regions. The color at each point is the magnitude of this Fourier component
for the 32 × 32-pixel dI/dV map centered at this
point. The small (≈20-Å) scale variations are due to finite size
effects in the Fourier transform. (d) The same map as for c
for the other peak.
References
-
- Zaanen, J. & Gunnarsson, O. (1989) Phys. Rev. B Condens. Matter 40, 7391–7394. - PubMed
-
- Emery, V. J. & Kivelson, S. A. (1993) Physica C 209, 597–621.
-
- Kivelson, S. A. & Emery, V. J. (1994) in Strongly Correlated Electronic Materials, Proceedings of the Los Alamos Symposium, 1993, eds. Bedell, K. S., Wang, Z., Meltzer, D. E., Balatsky, A. V. & Abrahams, E. (Addison–Wesley, Reading, MA), p. 619.
-
- Polkovnikov, A., Sachdev, S., Vojta, M. & Demler, E. (2002) Int. J. Mod. Phys. 16, 3156–3163.
LinkOut - more resources
Full Text Sources
Miscellaneous
