

Gene expression profiling in response to ultraviolet radiation in maize genotypes with varying flavonoid content
- PMID: 12913132
- PMCID: PMC181262
- DOI: 10.1104/pp.103.022871
Gene expression profiling in response to ultraviolet radiation in maize genotypes with varying flavonoid content
Abstract
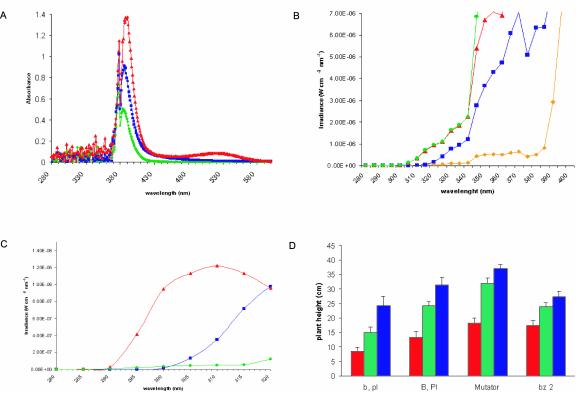
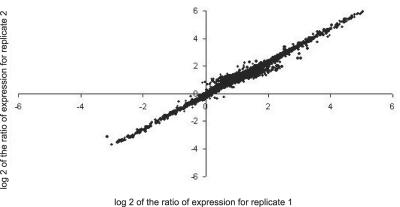
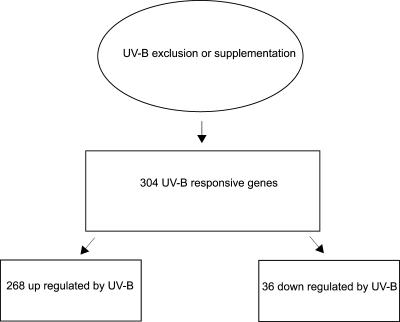
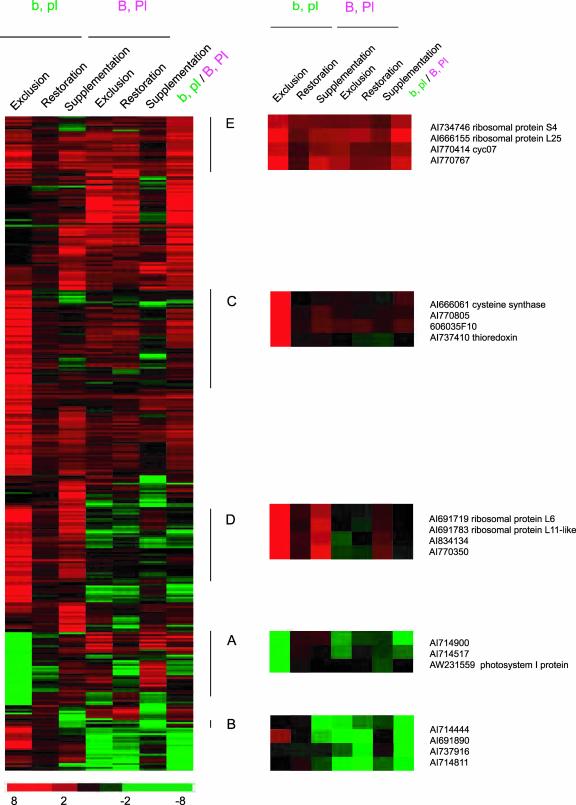
Microarray hybridization was used to assess acclimation responses to four UV regimes by near isogenic maize (Zea mays) lines varying in flavonoid content. We found that 355 of the 2,500 cDNAs tested were regulated by UV radiation in at least one genotype. Among these, 232 transcripts are assigned putative functions, whereas 123 encode unknown proteins. UV-B increased expression of stress response and ribosomal protein genes, whereas photosynthesis-associated genes were down-regulated; lines lacking UV-absorbing pigments had more dramatic responses than did lines with these pigments, confirming the shielding role of these compounds. Sunlight filtered to remove UV-B or UV-B plus UV-A resulted in significant expression changes in many genes not previously associated with UV responses. Some pathways regulated by UV radiation are shared with defense, salt, and oxidative stresses; however, UV-B radiation can activate additional pathways not shared with other stresses.
Figures


Similar articles
-
Rapid transcriptome responses of maize (Zea mays) to UV-B in irradiated and shielded tissues.Genome Biol. 2004;5(3):R16. doi: 10.1186/gb-2004-5-3-r16. Epub 2004 Mar 1. Genome Biol. 2004. PMID: 15003119 Free PMC article.
-
Analysis of leaf proteome after UV-B irradiation in maize lines differing in sensitivity.Mol Cell Proteomics. 2005 Nov;4(11):1673-85. doi: 10.1074/mcp.M500173-MCP200. Epub 2005 Jul 25. Mol Cell Proteomics. 2005. PMID: 16043824
-
Coordinated regulation of maize genes during increasing exposure to ultraviolet radiation: identification of ultraviolet-responsive genes, functional processes and associated potential promoter motifs.Plant Biotechnol J. 2007 Nov;5(6):677-95. doi: 10.1111/j.1467-7652.2007.00282.x. Plant Biotechnol J. 2007. PMID: 17924934
-
Response of the maize catalases to light.Free Radic Biol Med. 1997;23(3):497-504. doi: 10.1016/s0891-5849(97)00110-x. Free Radic Biol Med. 1997. PMID: 9214588 Review.
-
Regulation of the expression of NADP-malic enzyme by UV-B, red and far-red light in maize seedlings.Braz J Med Biol Res. 1999 Oct;32(10):1187-93. doi: 10.1590/s0100-879x1999001000002. Braz J Med Biol Res. 1999. PMID: 10510253 Review.
Cited by
-
The Identification of Maize and Arabidopsis Type I FLAVONE SYNTHASEs Links Flavones with Hormones and Biotic Interactions.Plant Physiol. 2015 Oct;169(2):1090-107. doi: 10.1104/pp.15.00515. Epub 2015 Aug 12. Plant Physiol. 2015. PMID: 26269546 Free PMC article.
-
Plant L10 ribosomal proteins have different roles during development and translation under ultraviolet-B stress.Plant Physiol. 2010 Aug;153(4):1878-94. doi: 10.1104/pp.110.157057. Epub 2010 Jun 1. Plant Physiol. 2010. PMID: 20516338 Free PMC article.
-
Overexpression of rice WRKY89 enhances ultraviolet B tolerance and disease resistance in rice plants.Plant Mol Biol. 2007 Dec;65(6):799-815. doi: 10.1007/s11103-007-9244-x. Epub 2007 Oct 25. Plant Mol Biol. 2007. PMID: 17960484
-
Comparative profiling of the sense and antisense transcriptome of maize lines.Genome Biol. 2006;7(3):R22. doi: 10.1186/gb-2006-7-3-r22. Epub 2006 Mar 13. Genome Biol. 2006. PMID: 16542496 Free PMC article.
-
Transcriptome changes in grapevine (Vitis vinifera L.) cv. Malbec leaves induced by ultraviolet-B radiation.BMC Plant Biol. 2010 Oct 20;10:224. doi: 10.1186/1471-2229-10-224. BMC Plant Biol. 2010. PMID: 20959019 Free PMC article.
References
-
- Arnots T, Murphy TM (1991) A comparison of the effects of a fungal elicitor and ultraviolet radiation on ion transport and hydrogen peroxide in rose cells. Environ Exp Bot 31: 209–216
-
- Ballaré CL, Rousseaux MC, Searles PS, Zaller JG, Giordano CV, Robson TM, Caldwell MM, Sala OE, Scopel AL (2001) Impacts of solar ultraviolet-B radiation on terrestrial ecosystems of Tierra del Fuego (southern Argentina): an overview of recent progress. J Photochem Photobiol B Biol 62: 67–77 - PubMed
-
- Bischof K, Krabs G, Wiencke C, Hanelt D (2002) Solar ultraviolet radiation affects the activity of ribulose-1,5-bisphosphate carboxylase-oxygenase and the composition of photosynthetic and xanthophyll cycle pigments in the intertidal green alga Ulva lactuca L. Planta 215: 502–509 - PubMed
Publication types
MeSH terms
Substances
LinkOut - more resources
Full Text Sources
Molecular Biology Databases
