

Microarray analysis of the genome-wide response to iron deficiency and iron reconstitution in the cyanobacterium Synechocystis sp. PCC 6803
- PMID: 12913140
- PMCID: PMC181269
- DOI: 10.1104/pp.103.024018
Microarray analysis of the genome-wide response to iron deficiency and iron reconstitution in the cyanobacterium Synechocystis sp. PCC 6803
Abstract
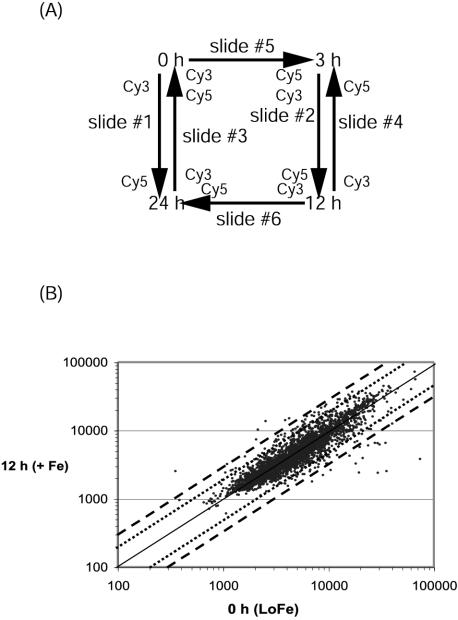
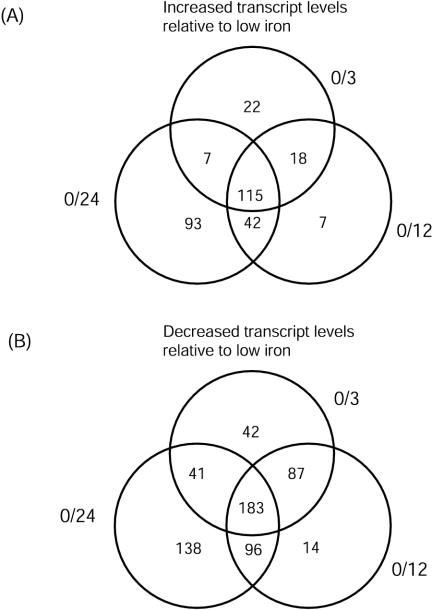
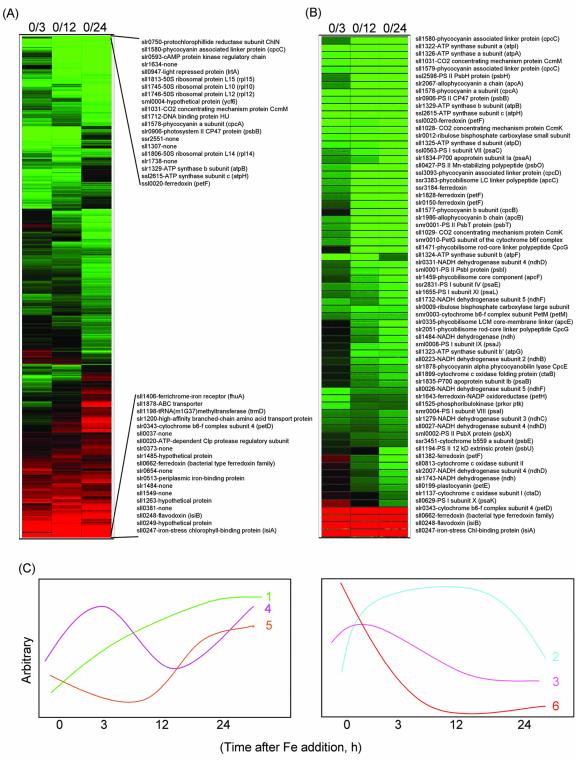
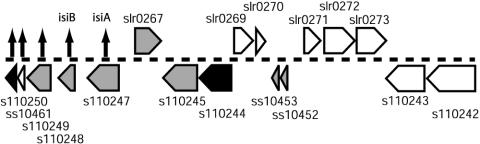
A full-genome microarray of the (oxy)photosynthetic cyanobacterium Synechocystis sp. PCC 6803 was used to identify genes that were transcriptionally regulated by growth in iron (Fe)-deficient versus Fe-sufficient media. Transcript accumulation for 3,165 genes in the genome was analyzed using an analysis of variance model that accounted for slide and replicate (random) effects and dye (a fixed) effect in testing for differences in the four time periods. We determined that 85 genes showed statistically significant changes in the level of transcription (P </= 0.05/3,165 = 0.0000158) across the four time points examined, whereas 781 genes were characterized as interesting (P </= 0.05 but greater than 0.0000158; 731 of these had a fold change >1.25 x). The genes identified included those known previously to be Fe regulated, such as isiA that encodes a novel chlorophyll-binding protein responsible for the pigment characteristics of low-Fe (LoFe) cells. ATP synthetase and phycobilisome genes were down-regulated in LoFe, and there were interesting changes in the transcription of genes involved in chlorophyll biosynthesis, in photosystem I and II assembly, and in energy metabolism. Hierarchical clustering demonstrated that photosynthesis genes, as a class, were repressed in LoFe and induced upon the re-addition of Fe. Specific regulatory genes were transcriptionally active in LoFe, including two genes that show homology to plant phytochromes (cph1 and cph2). These observations established the existence of a complex network of regulatory interactions and coordination in response to Fe availability.
Figures
Similar articles
-
DNA microarray analysis of redox-responsive genes in the genome of the cyanobacterium Synechocystis sp. strain PCC 6803.J Bacteriol. 2003 Mar;185(5):1719-25. doi: 10.1128/JB.185.5.1719-1725.2003. J Bacteriol. 2003. PMID: 12591891 Free PMC article.
-
Structure and light-regulated expression of phycoerythrin genes in wild-type and phycobilisome assembly mutants of Synechocystis sp. strain PCC 6701.J Bacteriol. 1990 Mar;172(3):1297-305. doi: 10.1128/jb.172.3.1297-1305.1990. J Bacteriol. 1990. PMID: 2106507 Free PMC article.
-
Photophysiological and photosynthetic complex changes during iron starvation in Synechocystis sp. PCC 6803 and Synechococcus elongatus PCC 7942.PLoS One. 2013;8(3):e59861. doi: 10.1371/journal.pone.0059861. Epub 2013 Mar 19. PLoS One. 2013. PMID: 23527279 Free PMC article.
-
[Complete genome sequence of a cyanobacterium Synechocystis sp. PCC 6803, the oxygenic photosynthetic prokaryote].Tanpakushitsu Kakusan Koso. 1996 Dec;41(16):2579-83. Tanpakushitsu Kakusan Koso. 1996. PMID: 8958765 Review. Japanese. No abstract available.
-
Regulation and Functional Complexity of the Chlorophyll-Binding Protein IsiA.Front Microbiol. 2021 Nov 17;12:774107. doi: 10.3389/fmicb.2021.774107. eCollection 2021. Front Microbiol. 2021. PMID: 34867913 Free PMC article. Review.
Cited by
-
Global proteomics reveal an atypical strategy for carbon/nitrogen assimilation by a cyanobacterium under diverse environmental perturbations.Mol Cell Proteomics. 2010 Dec;9(12):2678-89. doi: 10.1074/mcp.M110.000109. Epub 2010 Sep 21. Mol Cell Proteomics. 2010. PMID: 20858728 Free PMC article.
-
Synergic Effects of Temperature and Irradiance on the Physiology of the Marine Synechococcus Strain WH7803.Front Microbiol. 2020 Jul 24;11:1707. doi: 10.3389/fmicb.2020.01707. eCollection 2020. Front Microbiol. 2020. PMID: 32793165 Free PMC article.
-
Global gene expression of a delta PsbO:delta PsbU mutant and a spontaneous revertant in the cyanobacterium Synechocystis sp. strain PCC 6803.Photosynth Res. 2007 Nov-Dec;94(2-3):265-74. doi: 10.1007/s11120-007-9237-2. Epub 2007 Nov 8. Photosynth Res. 2007. PMID: 17990072
-
Transcription Profiling of the Model Cyanobacterium Synechococcus sp. Strain PCC 7002 by Next-Gen (SOLiD™) Sequencing of cDNA.Front Microbiol. 2011 Mar 7;2:41. doi: 10.3389/fmicb.2011.00041. eCollection 2011. Front Microbiol. 2011. PMID: 21779275 Free PMC article.
-
Study of excess manganese stress response highlights the central role of manganese exporter Mnx for holding manganese homeostasis in the cyanobacterium Synechocystis sp. PCC 6803.Microbiology (Reading). 2024 Nov;170(11):001515. doi: 10.1099/mic.0.001515. Microbiology (Reading). 2024. PMID: 39508727 Free PMC article.
References
-
- Arfin SM, Long AD, Ito ET, Tolleri L, Riehle MM, Paegle ES, Hatfield GW (2000) Global gene expression profiling in Escherichia coli K12. J Biol Chem 275: 29672–29684 - PubMed
-
- Bailey S, Thompson E, Nixon PJ, Horton P, Mullineaux CW, Robinson C, Mann NH (2002) A critical role for the Var2 FtsH homologue of Arabidopsis thaliana in the photosystem II repair cycle in vivo. J Biol Chem 277: 2006–2011 - PubMed
-
- Behrenfeld MJ, Kolber ZS (1999) Widespread iron limitation of phyto-plankton in the south pacific ocean. Science 283: 840–843 - PubMed
-
- Bibby TS, Nield J, Barber J (2001) Iron deficiency induces the formation of an antenna ring around trimeric photosystem I in cyanobacteria. Nature 412: 743–745 - PubMed
-
- Boekema EJ, Hlfney A, Yakushevska AE, Plotrowski M, Keegstra K, Berry S, Michel K-P, Pistorius EK, Krulp J (2001) A giant chlorophyll-protein complex induced by iron deficiency in cyanobacteria. Nature 412: 745–748 - PubMed
Publication types
MeSH terms
Substances
LinkOut - more resources
Full Text Sources
Medical
