. 2003 Aug;132(4):2058-72.
doi: 10.1104/pp.103.022236.

A bypass of sucrose synthase leads to low internal oxygen and impaired metabolic performance in growing potato tubers

Affiliations

A bypass of sucrose synthase leads to low internal oxygen and impaired metabolic performance in growing potato tubers

Karin L Bologa et al. Plant Physiol. 2003 Aug.

Abstract

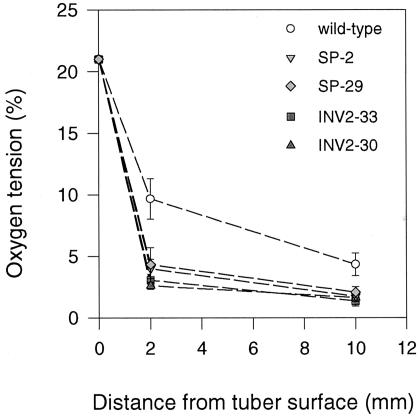
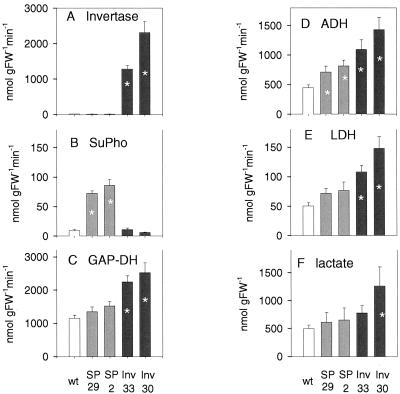
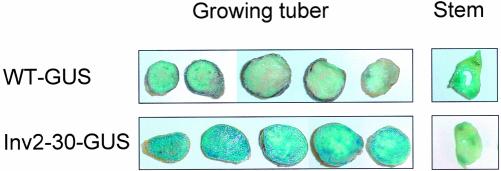
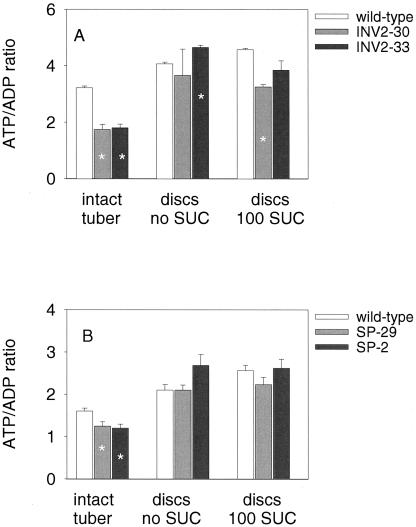
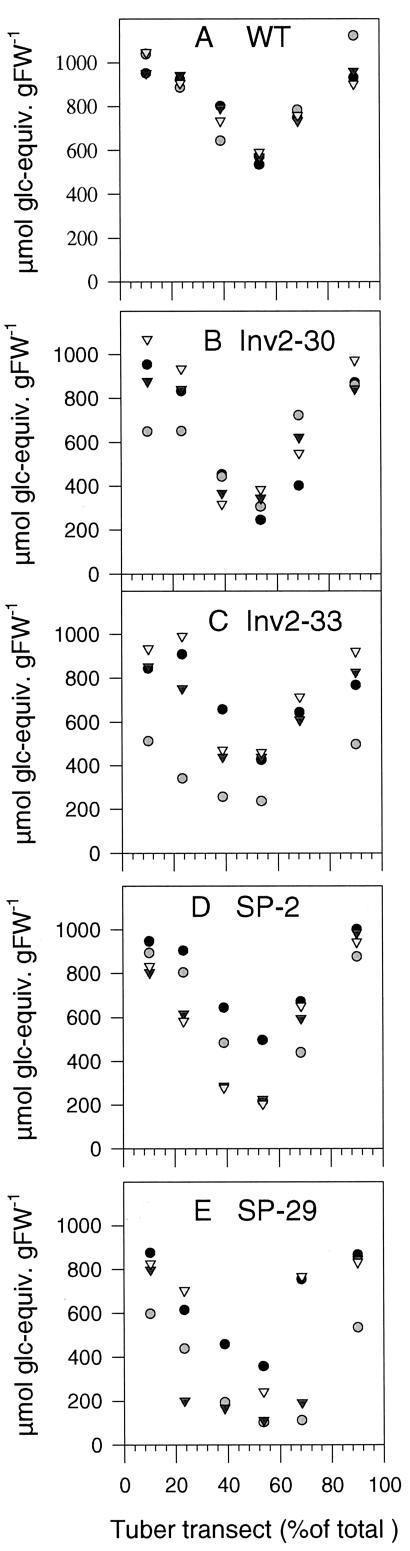
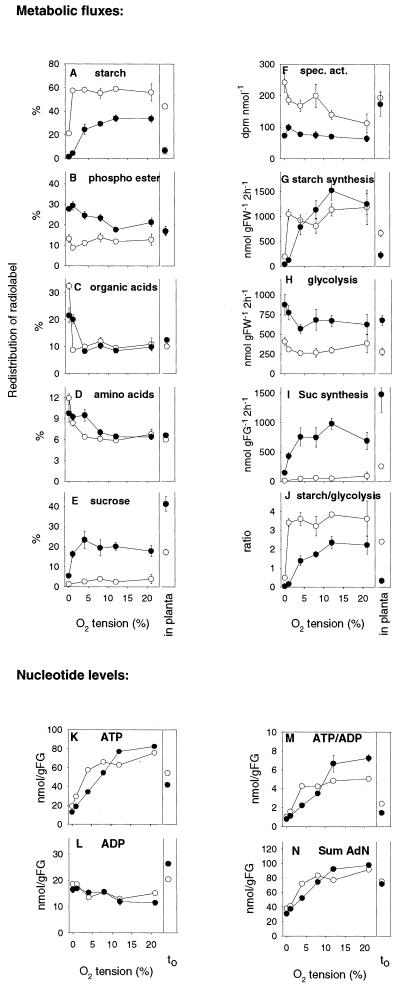
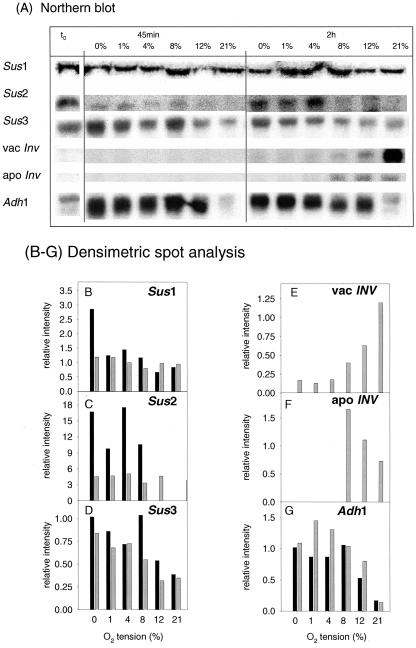
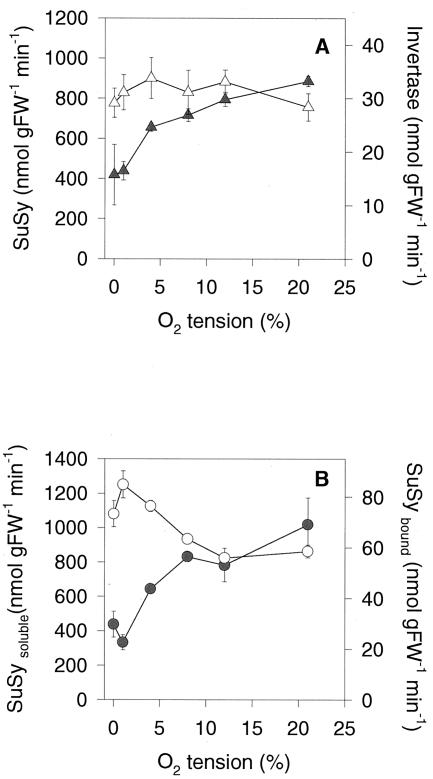
Plants possess two alternative biochemical pathways for sucrose (Suc) degradation. One involves hydrolysis by invertase followed by phosphorylation via hexokinase and fructokinase, and the other route-which is unique to plants-involves a UDP-dependent cleavage of Suc that is catalyzed by Suc synthase (SuSy). In the present work, we tested directly whether a bypass of the endogenous SuSy route by ectopic overexpression of invertase or Suc phosphorylase affects internal oxygen levels in growing tubers and whether this is responsible for their decreased starch content. (a) Oxygen tensions were lower within transgenic tubers than in wild-type tubers. Oxygen tensions decreased within the first 10 mm of tuber tissue, and this gradient was steeper in transgenic tubers. (b) Invertase-overexpressing tubers had higher activities of glyceraldehyde-3-phosphate dehydrogenase, lactate dehydrogenase, and alcohol dehydrogenase, and (c) higher levels of lactate. (d) Expression of a low-oxygen-sensitive Adh1-beta-glucuronidase reporter gene construct was more strongly induced in the invertase-overexpressing background compared with wild-type background. (e) Intact transgenic tubers had lower ATP to ADP ratios than the wild type. ATP to ADP ratio was restored to wild type, when discs of transgenic tubers were incubated at 21% (v/v) oxygen. (f) Starch decreased from the periphery to the center of the tuber. This decrease was much steeper in the transgenic lines, leading to lower starch content especially near the center of the tuber. (g) Metabolic fluxes (based on redistribution of (14)C-glucose) and ATP to ADP ratios were analyzed in more detail, comparing discs incubated at various external oxygen tensions (0%, 1%, 4%, 8%, 12%, and 21% [v/v]) with intact tubers. Discs of Suc phosphorylase-expressing lines had similar ATP to ADP ratios and made starch as fast as wild type in high oxygen but had lower ATP to ADP ratios and lower rates of starch synthesis than wild type at low-oxygen tensions typical to those found inside an intact tuber. (h) In discs of wild-type tubers, subambient oxygen concentrations led to a selective increase in the mRNA levels of specific SuSy genes, whereas the mRNA levels of genes encoding vacuolar and apoplastic invertases decreased. (i) These results imply that repression of invertase and mobilization of Suc via the energetically less costly route provided by SuSy is important in growing tubers because it conserves oxygen and allows higher internal oxygen tensions to be maintained than would otherwise be possible.


Figures

Figure 1.
Figure 1.
Oxygen gradients within invertase or Suc phosphorylase-expressing potato tubers analyzed using a microelectrode. Oxygen tensions were measured at the tuber surface and at different depth below the tuber periderm (2 and 10 mm). Oxygen tensions are plotted in relation to the distance from the tuber surface. Data are means ± se of separate tubers from different plants (n = 6 for wild type, n = 6 for INV2-30, n = 4 for INV2-33, n = 3 for SP-2, and n = 3 for SP-29). Error bars are not shown when they are smaller than the symbol.
Figure 2.
Figure 2.
Enzyme activities and lactate levels in invertase and Suc phosphorylase-expressing tubers. Activities of: A, invertase; B, Suc phosphorylase; C, GAP-DH; D, ADH; E, LDH; and levels of: F, lactate. Results are means ± se (n = 4 separate tubers from different plants). Error bars are not shown when they are smaller than the symbol. Significant changes from the wild type are marked with an asterisk (P < 0.05 using the Student's t test).
Figure 3.
Figure 3.
Expression of an ADH1-GUS reporter-gene construct introduced into INV2-30 and wild-type potato plants. Whole tubers (approximately 5–10 g fresh weight) were cut into 1-mm-thick slices from top to base, which were subsequently stained for GUS activity. A typical example is shown. Staining of the respective stem slices is shown in parallel.
Figure 4.
Figure 4.
Ectopic expression of invertase (A) or Suc phosphorylase (B) affects ATP to ADP ratios in growing tubers. Freshly cut slices of growing potato tubers were either immediately (within 2 s) quenched in liquid nitrogen (intact tuber) or incubated in aerated buffer with or without 100 mm Suc for 2 h before rapid quenching in liquid nitrogen, and then extracted to measure nucleotide levels. Data in A and B derive from two different experiments with different batches of plants. Data are means ± se (n = 3–4). Error bars are not shown when they are smaller than the symbol. Significant changes from the wild-type are marked with an asterisk (P < 0.05 using the Student's t test).
Figure 5.
Figure 5.
Starch profiles across invertase or Suc phosphorylase-expressing tubers. To investigate starch levels in tuber transects, a cork borer was forced through the middle, removed, and the tissue plug rapidly forced out and simultaneously sliced into approximately 1-mm-thick discs, which fell directly into liquid nitrogen. A, Wild-type; B, Inv2-30; C, Inv2-33; D, SP-2; and E, SP-29. Data are from four individual tubers per line. Total transects lengths were 3.3, 3.2, 3.4, 3.5, and 3.2 cm for wild type, Inv2-30, Inv2.-33, SP-2, and SP-29, respectively.
Figure 6.
Figure 6.
Metabolism of [U-14C]Glc and nucleotide levels in wild-type (white symbols) and Suc phosphorylase-expressing (black symbols) tubers and tuber discs. [U-14C]Glc was either injected directly into intact tubers (in planta) or was supplied to tuber slices incubated at different oxygen tensions. Freshly cut slices of growing potato tubers were incubated in a medium containing 1 mm Glc under continuous aeration using a stream of premixed gases containing 0%, 1%, 4%, 8%, 12%, or 21% (v/v) oxygen for 2 h as in Geigenberger et al. (2000) before slices were washed and extracted to determine label distribution into different fractions (A–E) or frozen rapidly to determine nucleotide levels (K–N). Percentages of label metabolized to starch (A), phosphorylated esters (B), organic acids (C), amino acids (D), and Suc (E) are shown. The specific activity of the hexose phosphate pool (F) was estimated by dividing the label retained in the phosphate ester pool by the summed carbon of the hexose phosphates (data not shown). The specific activity of the hexose phosphate pool and label incorporation into the relevant fractions were used to calculate the absolute rate of starch synthesis (G), glycolytic flux (the sum of the flux to the organic acids and amino acids; H), and the rate of Suc synthesis (I). J, Relative rates of starch synthesis and glycolysis. Nucleotide data are summarized in ATP (K), ADP (L), ATP to ADP ratio (M), and sum of ATP and ADP (N). Freshly cut slices of growing potato tubers immediately (within 2 s) quenched in liquid nitrogen (t0) are shown for comparison. The results are means ± se (n = 4). Error bars are not shown when they are smaller than the symbol.
Figure 7.
Figure 7.
Steady-state mRNA levels of Adh1 and specific SuSy and invertase genes in intact wild-type tubers (t0) and wild-type tuber slices incubated in buffer under continuous aeration using premixed gases as in Figure 6. Freshly cut slices of growing potato tubers were either immediately (within 2 s) quenched in liquid nitrogen (intact tuber) or incubated in aerated buffer for 45 min (black bars) or 2 h (gray bars) before rapidly quenching in liquid nitrogen, and RNA was extracted. A, Northern blot. B to G, Densitometric spot analysis of: B, Sus1; C, Sus2; D, Sus3; E, vacInv; F, apoInv; and G, Adh1. B to G, Relative intensities on an arbitrary scale which are corrected for the UV signal of the rRNA on the blotted membrane.
Figure 8.
Figure 8.
Changes in invertase and SuSy activities in tuber discs in response to low oxygen. A, Overall activities of acid invertase (black symbols) and SuSy (white symbols) after 8 h of incubation of discs at the different oxygen concentrations indicated in Figure 7. B, SuSy activity in the microsomal (black symbols) and soluble fraction (white symbols) of tuber discs incubated for 2 h at the different oxygen concentrations. The results are means ± se (n = 4). Error bars are not shown when they are smaller than the symbol.

References

    1. Amor Y, Haigler CH, Johnson S, Wainscott M, Delmer DP (1995) A membrane-associated form of sucrose synthase and its potential role in synthesis of cellulose and callose in plants. Proc Natl Acad Sci USA 92: 9353-9357 - PMC - PubMed
    1. Andrews DL, Cobb BG, Johnson JR, Drew MC (1993) Hypoxic and anoxic induction of alcohol dehydrogenase in roots and shoots of seedlings of Zea mays. Plant Physiol 101: 407-414 - PMC - PubMed
    1. Appeldoorn NJG, de Bruijn SM, Koot-Gronsveld EAM, Visser RGF, Vreugdenhil D, van der Plas LHW (1997) Developmental changes of enzymes involved in conversion of sucrose to hexose phosphate during early tuberisation of potato. Planta 202: 220-226
    1. ap Rees T (1984) Sucrose metabolism. In DH Lewis, ed, Storage carbohydrates in Vascular Plants. Cambridge University Press, Cambridge, UK pp 53-73
    1. Avigad G (1982) Sucrose and other disaccharides. In TA Loewus, W Tanner, eds, Encyclopedia of Plant Physiology. Springer-Verlag, Heidelberg, pp 217-347

Publication types

MeSH terms