. 2003 Aug 8;114(3):371-383.
doi: 10.1016/s0092-8674(03)00567-1.

H2AX haploinsufficiency modifies genomic stability and tumor susceptibility

Affiliations

H2AX haploinsufficiency modifies genomic stability and tumor susceptibility

Arkady Celeste et al. Cell. .

Abstract

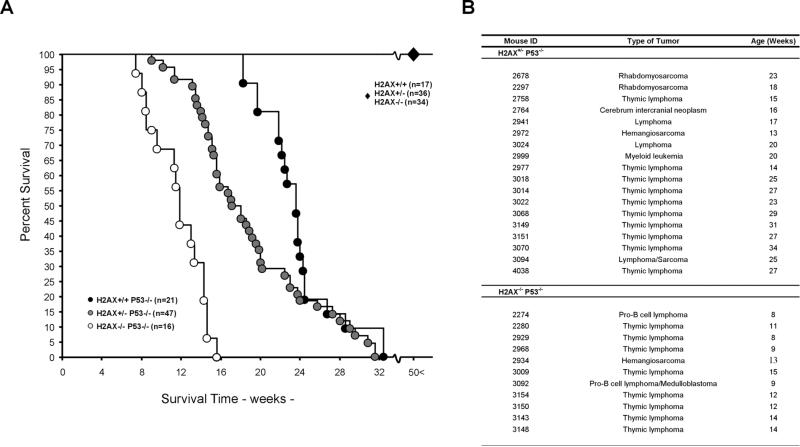
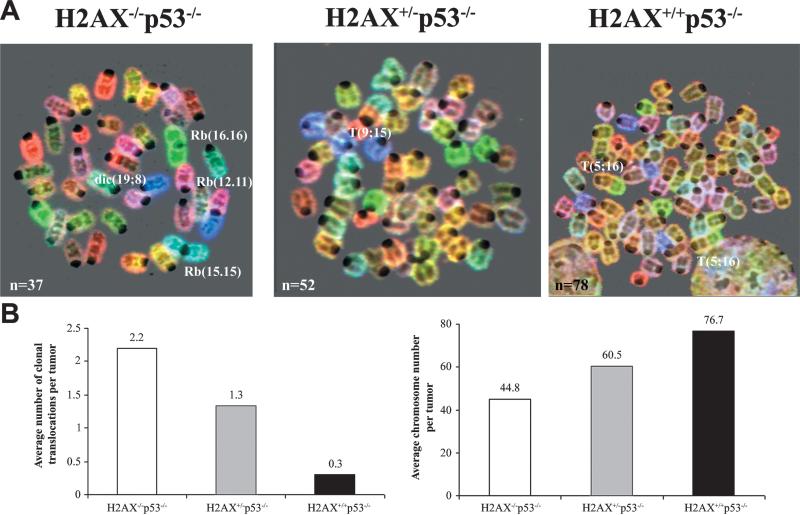
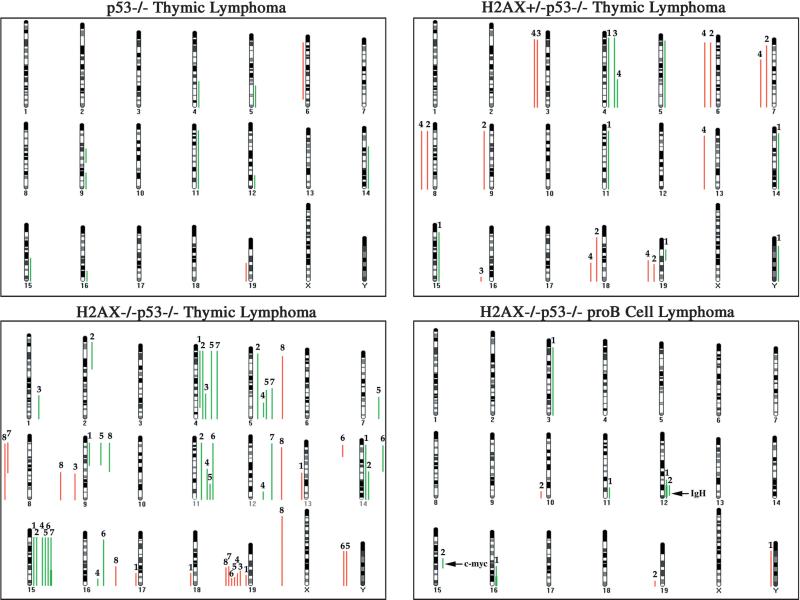
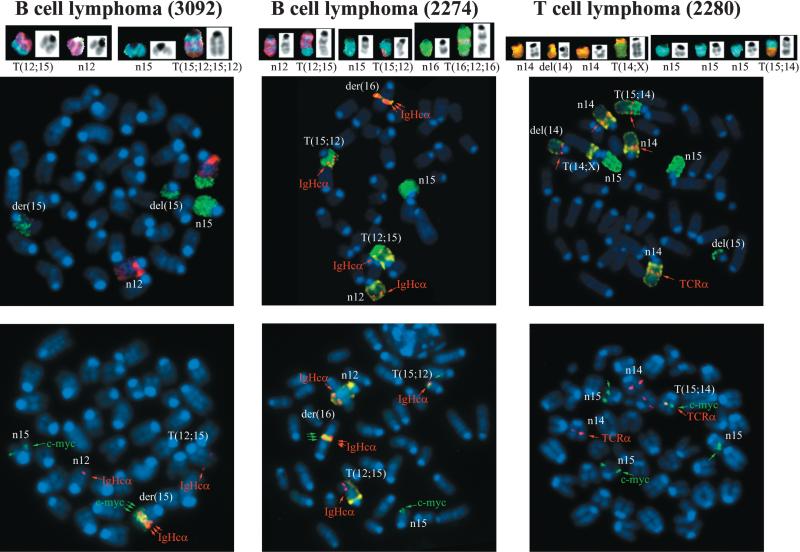
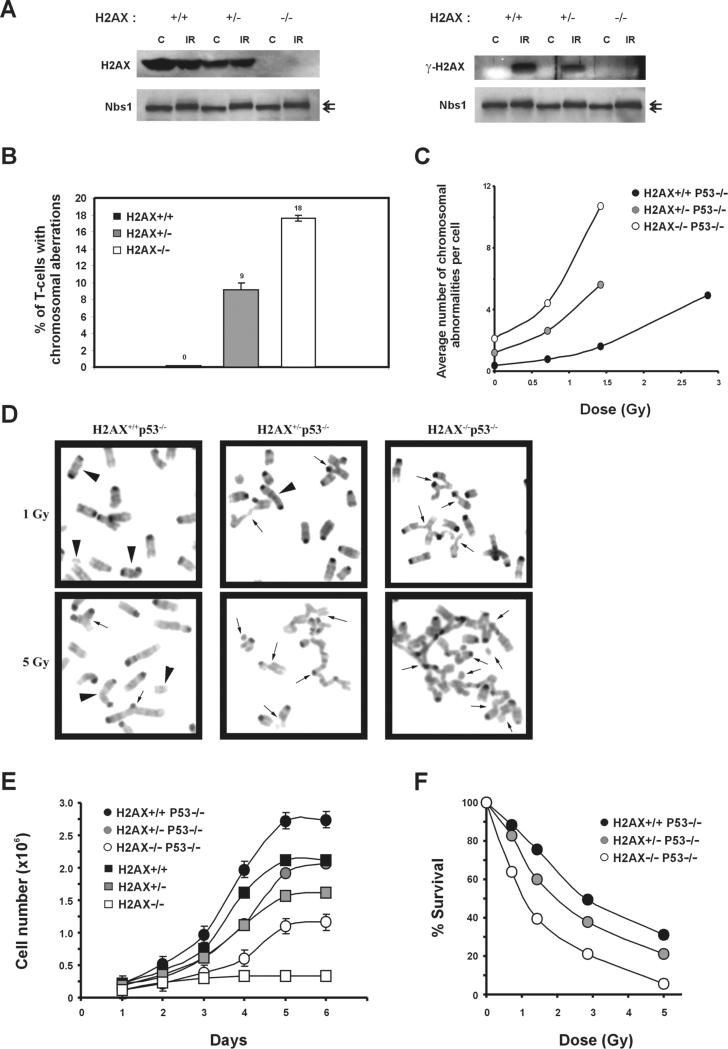
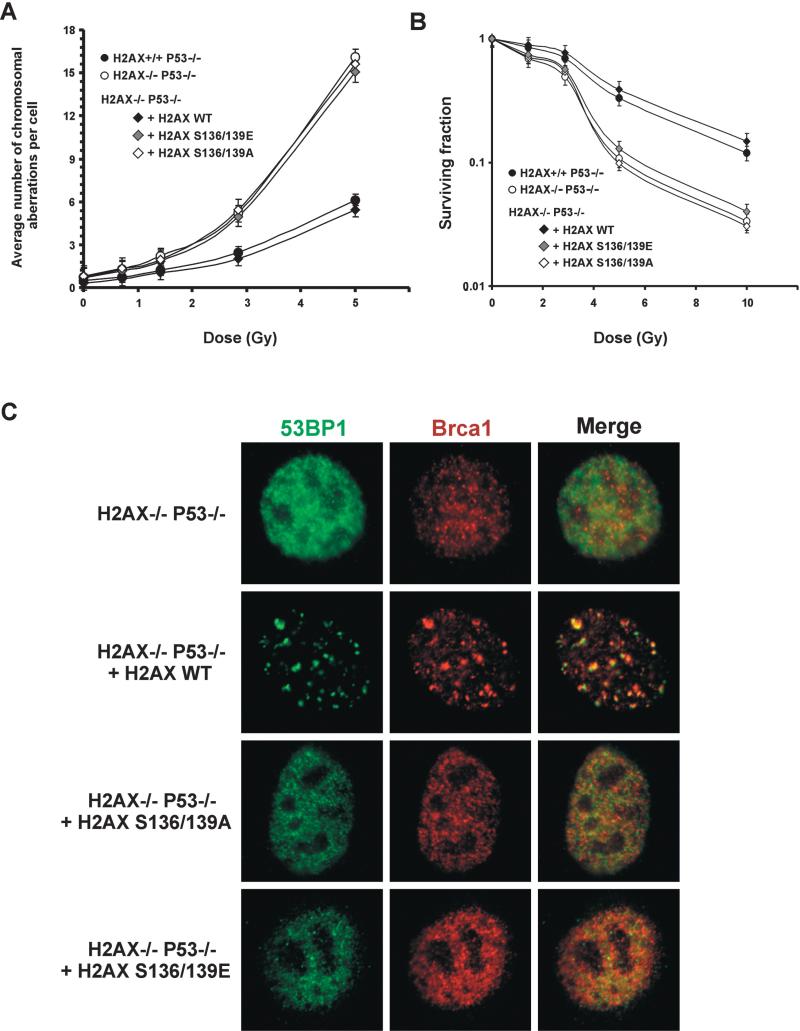
Histone H2AX becomes phosphorylated in chromatin domains flanking sites of DNA double-strand breakage associated with gamma-irradiation, meiotic recombination, DNA replication, and antigen receptor rearrangements. Here, we show that loss of a single H2AX allele compromises genomic integrity and enhances the susceptibility to cancer in the absence of p53. In comparison with heterozygotes, tumors arise earlier in the H2AX homozygous null background, and H2AX(-/-) p53(-/-) lymphomas harbor an increased frequency of clonal nonreciprocal translocations and amplifications. These include complex rearrangements that juxtapose the c-myc oncogene to antigen receptor loci. Restoration of the H2AX null allele with wild-type H2AX restores genomic stability and radiation resistance, but this effect is abolished by substitution of the conserved serine phosphorylation sites in H2AX with alanine or glutamic acid residues. Our results establish H2AX as genomic caretaker that requires the function of both gene alleles for optimal protection against tumorigenesis.


Figures

Figure 1
Figure 1. H2AX and p53 Deficiency Synergize in Tumorigenesis
(A) Survival curves for H2AX+/+, H2AX+/−, H2AX−/−, H2AX+/−p53−/−, H2AX+/−p53−/−, and H2AX−/−p53−/− mice. H2AX+/+, H2AX+/−, and H2AX−/− mice (indicated by large diamond) exhibited a tumor free survival for at least 50 weeks. Percent survival is plotted as a function of time in weeks. Number of mice analyzed is indicated. (B) Tumor spectrum in 15 H2AX+/−p53−/− and 11 H2AX−/−p53−/− mice. Four H2AX−/−p53−/− mice died of unknown causes (data not shown).
Figure 2
Figure 2. Structural and Numerical Aberrations in H2AX−/−p53−/−, H2AX+/−p53−/−, and H2AX+/+p53−/− Lymphomas
(A) SKY analysis of H2AX−/−p53−/− (left), H2AX+/−p53−/− (middle), and H2AX+/+p53−/− (right) thymic lymphomas. Structural aberrations include dicentric (dic) chromosomes, Robertsonian (Rb) fusions, and translocations (T). The total number of chromosomes counted in the metaphase spread is indicated in the lower left-hand corner. (B) Average number of clonal translocations (left bar graph) and average chromosome number (right bar graph) in H2AX−/−p53−/− (n = 10 tumors), H2AX+/− p53−/− (n = 6), and H2AX+/+p53−/− (n = 3) lymphomas.
Figure 3
Figure 3. CGH Analysis of H2AX−/−p53−/−, H2AX+/−p53−/−, and H2AX+/+p53−/− Lymphomas
Summary of CGH analysis using genomic DNA from a H2AX+/+p53−/− thymic lymphoma: designated 2976; four H2AX+/−p53−/− thymic lymphomas: 1, 3014; 2, 3022; 3, 3070; 4, 3149; and eight H2AX−/−p53−/− thymic lymphomas: 1, 2280; 2, 2929; 3, 2968; 4, 3009; 5, 3143; 6, 3148; 7, 3150; and 8, 3154; and two H2AX−/−p53−/− pro-B cell lymphomas: 1, 2274; and 2, 3092. Green bars on the right side of the ideograms indicate chromosome gains and red bars on the left side indicate chromosome losses. Thick bars (e.g., IgH locus in tumor 2274) indicate high-level amplification. All gains and losses for a single tumor are represented in numerical order equidistant from the individual chromosome ideogram. The chromosomal position of the IgH and c-myc loci is indicated in the pro-B cell lymphoma CGH map.
Figure 4
Figure 4. Fusions of the c-myc Oncogene to Antigen Receptor Loci in H2AX−/−p53−/− B and T Cell Lymphomas
Top: SKY analysis of H2AX−/−p53−/− pro-B cell (3092 and 2274) and thymic (2280) lymphomas. Translocations in pro-B and T cell lymphomas are similar to those observed in NHEJ-/p53-deficient lymphomas and ATM−/− thymomas respectively. Bottom: FISH analysis using chromosome 12, 15, and 14 painting probes combined with locus- (IgHCα, c-myc, and TCRα) specific probes. IgH and c-myc are juxtaposed and amplified (indicated by three arrows) in the pro-B cell lymphomas, and TCRα/c-myc are fused at the T(15; 14) translocation breakpoint in the thymic lymphoma.
Figure 5
Figure 5. Loss of One Copy of H2AX Leads to Genomic Instability
(A) Western blot analysis of H2AX (left) and γ-H2AX (right) protein in H2AX+/+, H2AX+/−, and H2AX−/− thymocytes before (C) and 30 min after treatment with 10 Gy γ-irradiation (IR). Nbs1 protein levels are shown below as loading controls. The position of phosphorylated Nbs1 relative to the unphosphorylated form is noted with arrows (upper and lower, respectively). (B) Lymph node T cells from H2AX+/+, H2AX+/−, and H2AX−/− littermates were cultured for 2 days, and metaphase spreads were examined for chromosomal aberrations. A total of 100 metaphases from two mice of each genotype were scored. (C) Passage 1 MEFs were either untreated or irradiated with graded doses of γ-irradiation, and metaphases were prepared 16 hr later. Average number of chromosome aberrations (breaks, fragments, and exchanges) is plotted. For each dose, at least 30 metaphases were examined for each genotype. (D) Examples of metaphases from H2AX+/+p53−/−, H2AX+/−p53−/−, and H2AX−/−p53−/− passage 1 MEFs after treatment with 1 Gy (top) and 5 Gy (lower panels) γ-irradiation. Arrowheads, chromosome type aberrations; arrows, chromatid type aberrations. (E) Growth kinetics of H2AX+/+, H2AX+/−, H2AX−/−, H2AX+/+p53−/−, H2AX+/−p53−/−, and H2AX−/−p53−/− MEFs at passage 1. The cell number is an average of duplicates from two independent cells lines of each genotype. The slopes (number of cells per day), calculated from early time points in curves, were: H2AX+/+, 8.67 × 10⁵; H2AX+/−, 4.88 × 10⁵; H2AX−/−, 3.10 × 10⁴; H2AX+/+p53−/−, 9.98 × 10⁵; H2AX+/−p53−/−, 5.11 × 10⁵; and H2AX−/−p53−/−, 2.22 × 10⁵. (F) Radiation sensitivity of H2AX+/+p53−/−, H2AX+/−p53−/−, and H2AX−/−p53−/− passage 1 MEFs, plotted as a fraction of surviving cells relative to unirradiated samples of the same genotype. Data were obtained from an average of duplicates from two independent cell lines.
Figure 6
Figure 6. Phosphorylation of H2AX at Serine 136 and 139 Is Essential for Maintaining Genomic Integrity, Radiation Resistance, and Irradiation-Induced Foci Formation
(A) Average number of chromosome aberrations in untreated and irradiated H2AX−/−p53−/−cells and H2AX−/−p53−/− cells reconstituted with wild-type H2AX (+H2AX wt), serine to alanine substituted H2AX (+H2AX S136/139A), and serine to glutamic acid substituted H2AX (+H2AX S136/139E). For each dose and genotype, at least 50 metaphases were examined. (B) Radiation sensitivity of immortalized reconstituted lines plotted as a fraction of surviving cells relative to unirradiated samples of the same genotype. The calculated survival represents the average from two independent cell lines (H2AX−/−p53−/−, DKO13 and DKO15; H2AX+/+p53−/−, PW4 and PW16; +H2AX wt, R6 and R20; +H2AX S136A/S139A, A7 and A8; and +H2AX S136E/S139E, E2 and E5) of each genotype. (C) 53BP1 (green) and Brca1 (red) staining pattern in reconstituted lines 2 hr after treatment with 10 Gy irradiation. Images were merged (right) to determine colocalization. The wild-type, but not the serine to glutamic acid or serine to alanine reconstituted lines, restores 53BP1 and Brca1 foci formation. Similar results were obtained at 6 hr postirradiation.

Similar articles

Cited by

References

    1. Agrawal A, Schatz DG. RAG1 and RAG2 form a stable postcleavage synaptic complex with DNA containing signal ends in V(D)J recombination. Cell. 1997;89:43–53. - PubMed
    1. Alt JR, Greiner TC, Cleveland JL, Eischen CM. Mdm2 haploinsufficiency profoundly inhibits Myc-induced lymphomagenesis. EMBO J. 2003;22:1442–1450. - PMC - PubMed
    1. Bai F, Pei XH, Godfrey VL, Xiong Y. Haploinsufficiency of p18(INK4c) sensitizes mice to carcinogen-induced tumorigenesis. Mol. Cell. Biol. 2003;23:1269–1277. - PMC - PubMed
    1. Barlow C, Hirotsune S, Paylor R, Liyanage M, Eckhaus M, Collins F, Shiloh Y, Crawley JN, Ried T, Tagle D, Wynshaw-Boris A. Atm-deficient mice: a paradigm of ataxia telangiectasia. Cell. 1996;86:159–171. - PubMed
    1. Bassing CH, Chua KF, Sekiguchi J, Suh H, Whitlow SR, Fleming JC, Monroe BC, Ciccone DN, Yan C, Vlasakova K, et al. Increased ionizing radiation sensitivity and genomic instability in the absence of histone H2AX. Proc. Natl. Acad. Sci. USA. 2002a;99:8173–8178. - PMC - PubMed

MeSH terms