. 2003 Sep;13(9):2092-100.
doi: 10.1101/gr.1240103. Epub 2003 Aug 12.

Transcriptional response of lymphoblastoid cells to ionizing radiation

Affiliations

Transcriptional response of lymphoblastoid cells to ionizing radiation

Kuang-Yu Jen et al. Genome Res. 2003 Sep.

Abstract

The effects of ionizing radiation (IR) on the temporal transcriptional response of lymphoblastoid cells were investigated in this study. We used oligonucleotide microarrays to assess mRNA levels of genes in lymphoblastoid cells at various time points within 24 h following gamma-irradiation. We identified 319 and 816 IR-responsive genes following 3 Gy and 10 Gy of IR exposure, respectively, with 126 genes in common between the two doses. A high percentage of IR-responsive genes are involved in the control of cell cycle, cell death, DNA repair, DNA metabolism, and RNA processing. We determined the temporal expression profiles of the IR-responsive genes and assessed effects of IR dose on this temporal pattern of expression. By combining dose-response data with temporal profiles of expression, we have identified sets of coordinately responding genes. Through a genomic approach, we characterized a set of genes that are implicated in cellular adaptation to IR stress. These findings will allow a better understanding of complex processes such as radiation-induced carcinogenesis and the development of biomarkers for radiation exposure.


Figures

Figure 1
Figure 1
Comparison of U95A GeneChip data (gray bars) to quantitative RT–PCR (black bars). The quantitative RT–PCR values are means and standard errors for changes in expression levels (n = 8) at 12 h postirradiation following 10 Gy of IR exposure. GAPDH was used as a negative control. All genes were normalized to β-actin levels. U95A GeneChip values are derived from 10 individual cell lines pooled together at the same experimental conditions.
Figure 2
Figure 2
Functional grouping of IR-responsive genes. A black asterisk indicates categories significantly different from the non-IR-responsive genes on the U95A GeneChip (P <0.05 for each comparison after correcting for multiple testing). A red asterisk indicates categories significantly different between IR-responsive genes for 3 Gy and 10 Gy doses. Only genes with GO designations were used in the analysis. The standard error of the percentage of genes ranges from 1.0% to 3.0% for 3 Gy and 0.6% to 1.5% for 10 Gy.
Figure 3
Figure 3
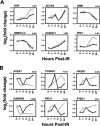
Genes with the most similar (A) and the least similar (B) expression profiles between the 3 Gy (solid line) and 10 Gy (broken line) doses. For each gene, the correlation coefficients between the expression profiles are indicated at the top, right.
Figure 4
Figure 4
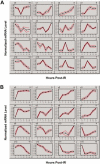
Gene expression patterns for the 126 IR-responsive genes in common between 3 Gy (A) and 10 Gy (B) doses. Clusters were generated using self-organizing maps (GeneCluster 2.0). Clusters for each dose were calculated separately. For each cluster, the cluster number is indicated at the top, left, and the number of genes assigned to each cluster is indicated at the top, right. Graphs for each cluster show cluster means (black line) flanked by standard deviations (red lines). Each gene was normalized across time points to have mean = 0 and SD = 1.
Figure 5
Figure 5
Examples of sets of IR-responsive genes that belong to the same cluster, independent of IR dosage. Dose and cluster membership (see Fig. 4) are indicated to the right of each graph.

References

    1. Amundson, S.A., Bittner, M., Chen, Y., Trent, J., Meltzer, P., and Fornace Jr., A.J. 1999. Fluorescent cDNA microarray hybridization reveals complexity and heterogeneity of cellular genotoxic stress responses. Oncogene 18: 3666–3672. - PubMed
    1. Amundson, S.A., Do, K.T., Shahab, S., Bittner, M., Meltzer, P., Trent, J., and Fornace Jr., A.J. 2000. Identification of potential mRNA biomarkers in peripheral blood lymphocytes for human exposure to ionizing radiation. Radiat. Res. 154: 342–346. - PubMed
    1. Amundson, S.A., Lee, R.A., Kock-Paiz, C.A., Bittner, M.L., Meltzer, P., Trent, J.M., and Fornace Jr., A.J. 2003. Differential responses of stress genes to low dose-rate γ irradiation. Mol. Cancer Res. 1: 445–452. - PubMed
    1. Ashburner, M., Ball, C.A., Blake, J.A., Botstein, D., Butler, H., Cherry, J.M., Davis, A.P., Dolinski, K., Dwight, S.S., Eppig, J.T., et al. 2000. Gene ontology: Tool for the unification of biology. The Gene Ontology Consortium. Nat. Genet. 25: 25–29. - PMC - PubMed
    1. Asher, G., Lotem, J., Cohen, B., Sachs, L., and Shaul, Y. 2001. Regulation of p53 stability and p53-dependent apoptosis by NADH quinone oxidoreductase 1. Proc. Natl. Acad. Sci. 98: 1188–1193. - PMC - PubMed

Publication types

MeSH terms