. 2003 Sep;13(9):1998-2004.
doi: 10.1101/gr.1649303. Epub 2003 Aug 12.

The human transcriptome map reveals extremes in gene density, intron length, GC content, and repeat pattern for domains of highly and weakly expressed genes

Affiliations

The human transcriptome map reveals extremes in gene density, intron length, GC content, and repeat pattern for domains of highly and weakly expressed genes

Rogier Versteeg et al. Genome Res. 2003 Sep.

Abstract

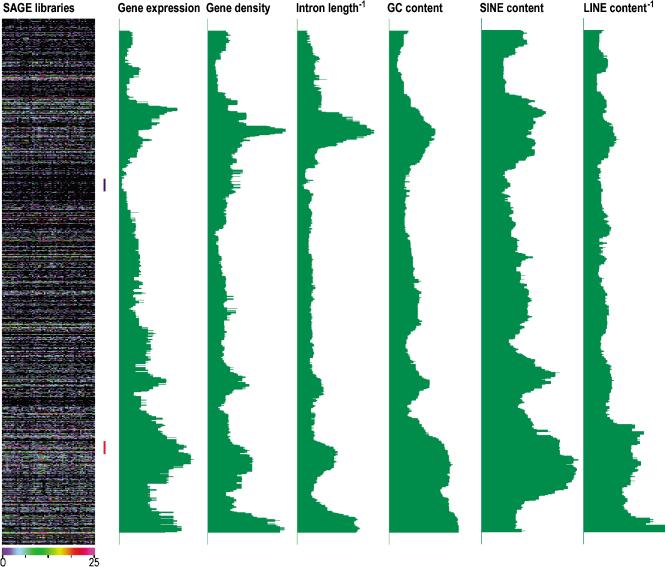
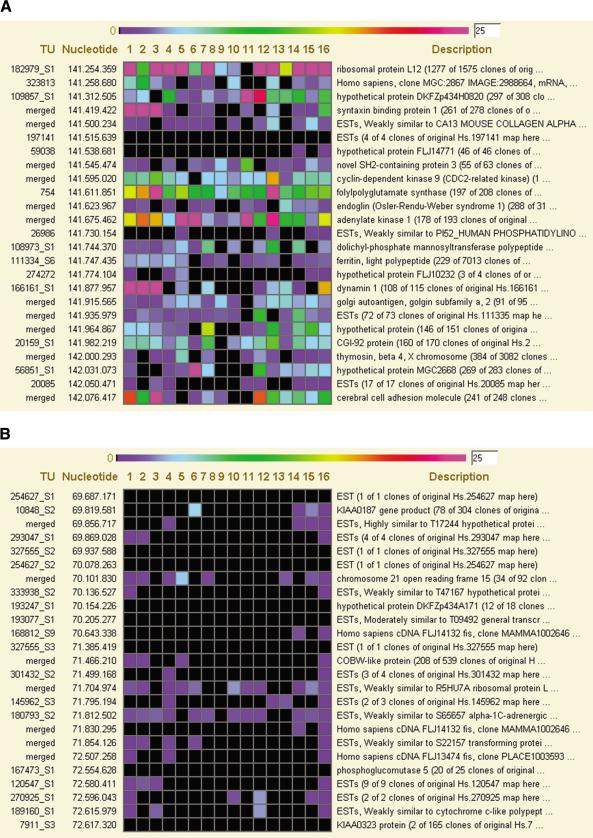
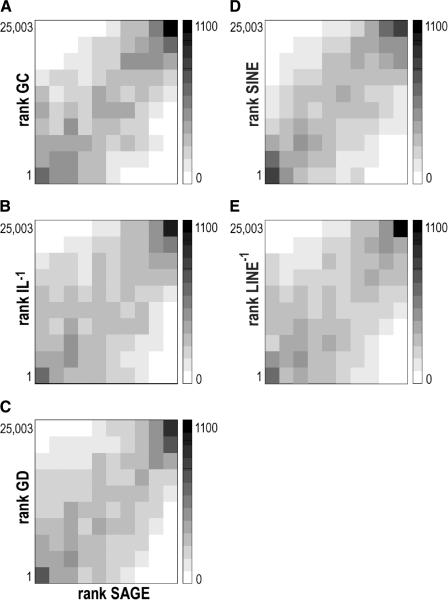
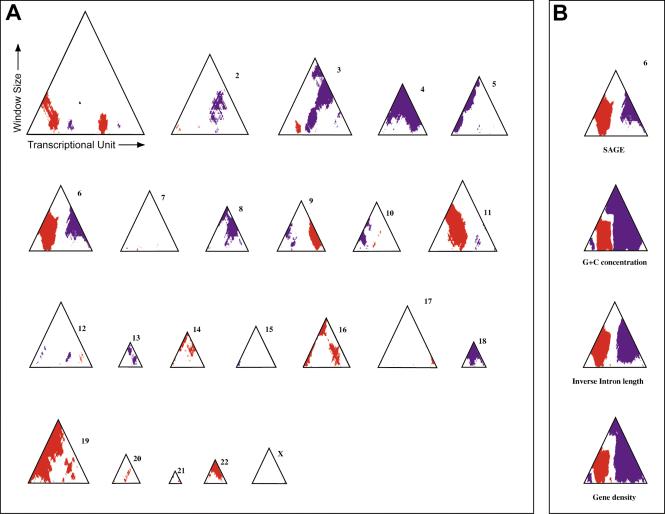
The chromosomal gene expression profiles established by the Human Transcriptome Map (HTM) revealed a clustering of highly expressed genes in about 30 domains, called ridges. To physically characterize ridges, we constructed a new HTM based on the draft human genome sequence (HTMseq). Expression of 25,003 genes can be analyzed online in a multitude of tissues (http://bioinfo.amc.uva.nl/HTMseq). Ridges are found to be very gene-dense domains with a high GC content, a high SINE repeat density, and a low LINE repeat density. Genes in ridges have significantly shorter introns than genes outside of ridges. The HTMseq also identifies a significant clustering of weakly expressed genes in domains with fully opposite characteristics (antiridges). Both types of domains are open to tissue-specific expression regulation, but the maximal expression levels in ridges are considerably higher than in antiridges. Ridges are therefore an integral part of a higher order structure in the genome related to transcriptional regulation.


Figures

Figure 1
Figure 1
Profiles of gene expression, gene density, inverse intron length, GC content, SINE density, and inverse LINE density of human chromosome 9. The left color chart shows expression data from 62 SAGE libraries of 50,000 or more transcript tags. Each horizontal line is a transcription unit (TU). Vertical rows are individual SAGE libraries. The levels of expression are given by a color code, ranging from zero to the here chosen maximum of 25 or more tags/100,000 transcript tags in a library; Green profiles: moving medians of the gene expression levels, gene density, inverse intron length, GC content, SINE density and inverse LINE density at window size 49. Expression levels are taken from all combined SAGE libraries, totaling to 5,959,046 tags (SAGE all tissues). See Figure 6 of the Supplemental Information for profiles of all human chromosomes.
Figure 4
Figure 4
Genes in ridges and antiridges can have tissue-specific expression patterns. (A) Expression pattern of 25 genes in a ridge on chromosome 9. The region of the ridge is indicated in Figure 1 by a red bar. The figure is taken from the HTMseq Web site and represents the concise view level of the application. Each horizontal line gives the TU number, the start nucleotide position of the gene on chromosome 9, the level of expression of the gene in 16 tissue-type SAGE libraries, and the description line of the TU. The level of expression is given by a color code ranging from 0–25 tags/100,000 tags in the SAGE library (see color scale at top). The SAGE libraries shown are (1) brain normal; (2) brain normal cerebellum; (3) brain normal white matter; (4) breast normal; (5) colon normal; (6) heart normal; (7) kidney normal; (8) leucocyte normal; (9) liver normal; (10) lung normal; (11) ovary normal; (12) pancreas normal; (13) peritoneum normal; (14) prostate normal; (15) vascular endothelium normal; (16) all normal tissues; (B) The same analysis for an antiridge on chromosome 9 (indicated by blue bar in Fig. 1). The SAGE libraries are as indicated above.
Figure 2
Figure 2
Analysis of the rank correlation between median gene expression and median GC content (A), median inverse intron length (B), median gene density (C), median SINE density (D), and median inverse LINE density (E). The shade of each square corresponds to the number of genes. The values obtained for window size 49 are shown.
Figure 3
Figure 3
Identification of chromosomal regions of significant extremes in gene expression, gene density, intron length, and GC content. (A) Ridgeograms of the gene expression of all human chromosomes showing the ridges (red) and antiridges (blue) as function of window size. The horizontal axis of each triangle gives the position of the TUs along each chromosome (left, top of the p arm; right, distal end of the q arm). The vertical axis gives the window size, increasing from window size 19 until the maximum possible window size for each chromosome; (B) Ridgeogram of chromosome 6 together with significance plots of extremes in GC content, inverse intron length and gene density.
Figure 5
Figure 5
Both maximal and average gene expressions in a series of SAGE libraries follow the pattern of ridges and antiridges. The profiles of average (blue) and maximal (red) gene expression as found in 57 SAGE libraries of minimally 50,000 SAGE tags are shown for chromosome 9 (w = 49).

References

    1. Benjamini, Y.I. and Hochberg, Y. 1995. Controlling the false discovery rate: A practical and powerful approach to multiple testing. J. R. Stat. Soc. Ser. B Meth. 57: 289–300.
    1. Caron, H., van Schaik, B., van der Mee, M., Baas, F., Riggins, G., van Sluis, P., Hermus, M.C., van Asperen, R., Boon, K., Voute, P.A., et al. 2001. The human transcriptome map: Clustering of highly expressed genes in chromosomal domains. Science 291: 1289–1292. - PubMed
    1. Castillo-Davis, C.I., Mekhedov, S.L., Hartl, D.L., Koonin, E.V., and Kondrashov, F.A. 2002. Selection for short introns in highly expressed genes. Nat. Genet. 31: 415–418. - PubMed
    1. Cohen, B.A., Mitra, R.D., Hughes, J.D., and Church, G.M. 2000. A computational analysis of whole-genome expression data reveals chromosomal domains of gene expression. Nat. Genet. 26: 183–186. - PubMed
    1. Fujii, T., Dracheva, T., Player, A., Chacko, S., Clifford, R., Strausberg, R.L., Buetow, K., Azumi, N., Travis, W.D., and Jen, J. 2002. A preliminary transcriptome map of non-small cell lung cancer. Cancer Res. 62: 3340–3346. - PubMed

WEB SITE REFERENCES

    1. http://genome.ucsc.edu/; UCSC Genome Bioinformatics.
    1. http://www.ncbi.nlm.nih.gov/SAGE; NCBI CGAP SAGE project
    1. http://bioinfo.amc.uva.nl/HTMseq; HTMseq Web site.

Publication types