

Comparison of optic nerve head assessment with a digital stereoscopic camera (discam), scanning laser ophthalmoscopy, and stereophotography
- PMID: 12917163
- PMCID: PMC1939717
- DOI: 10.1016/S0161-6420(03)00496-2
Comparison of optic nerve head assessment with a digital stereoscopic camera (discam), scanning laser ophthalmoscopy, and stereophotography
Abstract
Purpose: To compare computer-assisted planimetry using the Discam system (Marcher Enterprises Ltd., Hereford, UK), confocal scanning laser ophthalmoscopy (CSLO), and stereoscopic disc photography with respect to optic nerve head (ONH) measurements and glaucoma status.
Design: Comparative, observational case series and interobserver variability study.
Methods: Three hundred eighty-six eyes of 233 consecutive subjects were imaged with the Discam, and a subset underwent ONH evaluation with CSLO (n = 297), stereoscopic photography (n = 233), or both. Subjects were classified into normal, glaucoma suspect, and glaucoma groups based on clinical findings of slit-lamp disc examination and visual field testing. Agreement of cup-to-disc ratio measurements among the three technologies was assessed by the intraclass correlation coefficient (ICC) and areas under the receiver operator characteristic (AROC) curves.
Main outcome measures: Cup-to-disc ratio as measured by Discam, CSLO, and stereography.
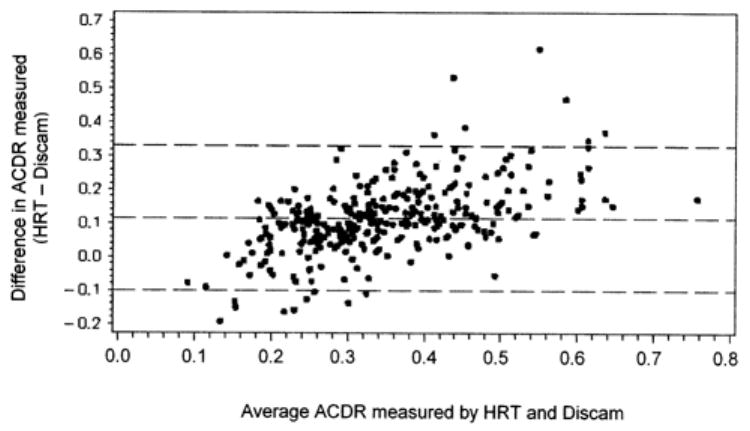
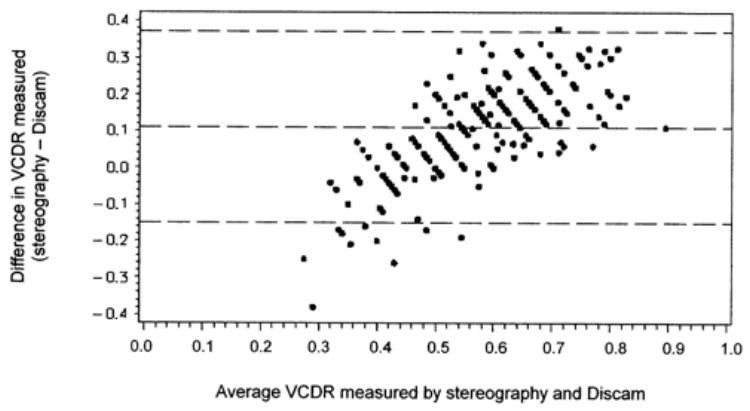
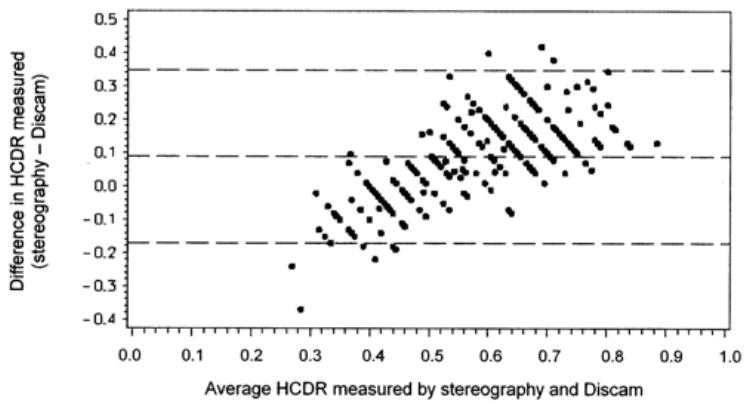
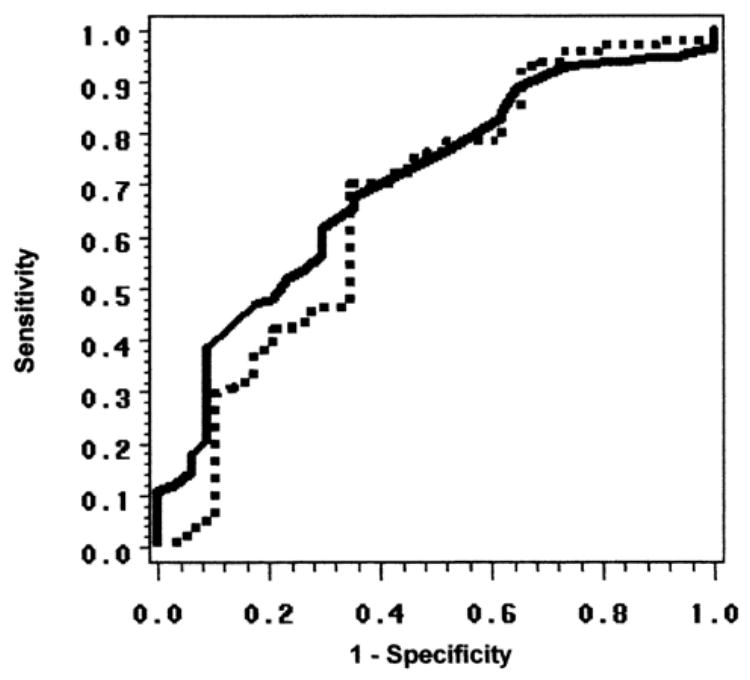
Results: Intraclass correlation coefficients calculated using the two-way random effects model for comparing Discam, CSLO, and stereography among cup-to-disc area ratio, vertical cup-to-disc ratio, and horizontal cup-to-disc ratio were 0.46 to 0.53. The ICC was higher for eyes with larger optic discs (0.51) than those with smaller ones (0.32). The ICC calculated using the fixed effects model for the Discam and CSLO comparison was 0.72. Areas under the receiver operator characteristic curves were 0.67 to 0.80 among the three technologies comparing normal with glaucomatous eyes. In general, there was no statistically significant difference between techniques with respect to sensitivity and specificity of glaucoma detection.
Conclusions: There is good agreement between ONH measurements obtained by Discam, CSLO, and stereography; however, the results are not interchangeable. Similar AROC curve values among all three techniques imply that the Discam, CSLO, and stereography perform equally for the determination of glaucoma status.
Figures
Similar articles
-
Agreement in assessing optic discs with a digital stereoscopic optic disc camera (Discam) and Heidelberg retina tomograph.Br J Ophthalmol. 2002 Feb;86(2):196-202. doi: 10.1136/bjo.86.2.196. Br J Ophthalmol. 2002. PMID: 11815347 Free PMC article.
-
Agreement between stereoscopic photographs, clinical assessment, Heidelberg retina tomograph and digital stereoscopic optic disc camera in estimating vertical cup:disc ratio.Clin Exp Ophthalmol. 2005 Jun;33(3):259-63. doi: 10.1111/j.1442-9071.2005.01000.x. Clin Exp Ophthalmol. 2005. PMID: 15932529
-
Comparison of optic nerve head measurements obtained by optical coherence tomography and confocal scanning laser ophthalmoscopy.Am J Ophthalmol. 2003 Apr;135(4):504-12. doi: 10.1016/s0002-9394(02)02093-7. Am J Ophthalmol. 2003. PMID: 12654368
-
Comparison of confocal scanning laser ophthalmoscopy, scanning laser polarimetry and optical coherence tomography to discriminate ocular hypertension and glaucoma at an early stage.Graefes Arch Clin Exp Ophthalmol. 2006 Jan;244(1):58-68. doi: 10.1007/s00417-005-0029-0. Epub 2005 Jul 26. Graefes Arch Clin Exp Ophthalmol. 2006. PMID: 16044326
-
Subjective and objective optic nerve assessment in African Americans and whites.Invest Ophthalmol Vis Sci. 2004 Jul;45(7):2272-8. doi: 10.1167/iovs.03-0996. Invest Ophthalmol Vis Sci. 2004. PMID: 15223805
Cited by
-
Test-retest variability in structural parameters measured with glaucoma imaging devices.Jpn J Ophthalmol. 2013 Jan;57(1):1-24. doi: 10.1007/s10384-012-0181-0. Epub 2012 Nov 9. Jpn J Ophthalmol. 2013. PMID: 23138681 Review.
-
[Measurement of the disc area by indirect ophthalmoscopy].Ophthalmologe. 2009 Feb;106(2):141-8. doi: 10.1007/s00347-008-1774-3. Ophthalmologe. 2009. PMID: 18546001 German.
-
Detection of optic nerve head neural canal opening within histomorphometric and spectral domain optical coherence tomography data sets.Invest Ophthalmol Vis Sci. 2009 Jan;50(1):214-23. doi: 10.1167/iovs.08-2302. Epub 2008 Aug 8. Invest Ophthalmol Vis Sci. 2009. PMID: 18689697 Free PMC article.
-
The effect of education on the assessment of optic nerve head photographs for the glaucoma diagnosis.BMC Ophthalmol. 2011 May 19;11:12. doi: 10.1186/1471-2415-11-12. BMC Ophthalmol. 2011. PMID: 21595936 Free PMC article.
-
Agreement in assessing cup-to-disc ratio measurement among stereoscopic optic nerve head photographs, HRT II, and Stratus OCT.J Glaucoma. 2006 Jun;15(3):183-9. doi: 10.1097/01.ijg.0000212216.19804.ee. J Glaucoma. 2006. PMID: 16778638 Free PMC article.
References
-
- Quigley HA, Dunkelberger GR, Green WR. Chronic human glaucoma causing selectively greater loss of large optic nerve fibers. Ophthalmology. 1988;95:357–63. - PubMed
-
- Sommer A, Katz J, Quigley HA, et al. Clinically detectable nerve fiber atrophy precedes the onset of glaucomatous field loss. Arch Ophthalmol. 1991;109:77–83. - PubMed
-
- Zeyen TG, Caprioli J. Progression of disc and field damage in early glaucoma. Arch Ophthalmol. 1993;111:62–5. - PubMed
-
- Airaksinen PJ, Drance SM, Douglas GR, et al. Neuroretinal rim areas and visual field indices in glaucoma. Am J Ophthalmol. 1985;99:107–10. - PubMed
-
- Caprioli J, Miller JM. Correlation of structure and function in glaucoma. Quantitative measurements of disc and field. Ophthalmology. 1988;95:723–7. - PubMed
Publication types
MeSH terms
Grants and funding
LinkOut - more resources
Full Text Sources
Medical
