. 2003 Sep;23(17):6255-66.
doi: 10.1128/MCB.23.17.6255-6266.2003.

Morphine induces desensitization of insulin receptor signaling

Affiliations

Morphine induces desensitization of insulin receptor signaling

Yu Li et al. Mol Cell Biol. 2003 Sep.

Abstract

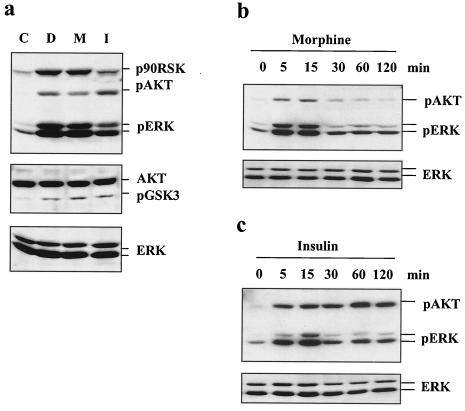
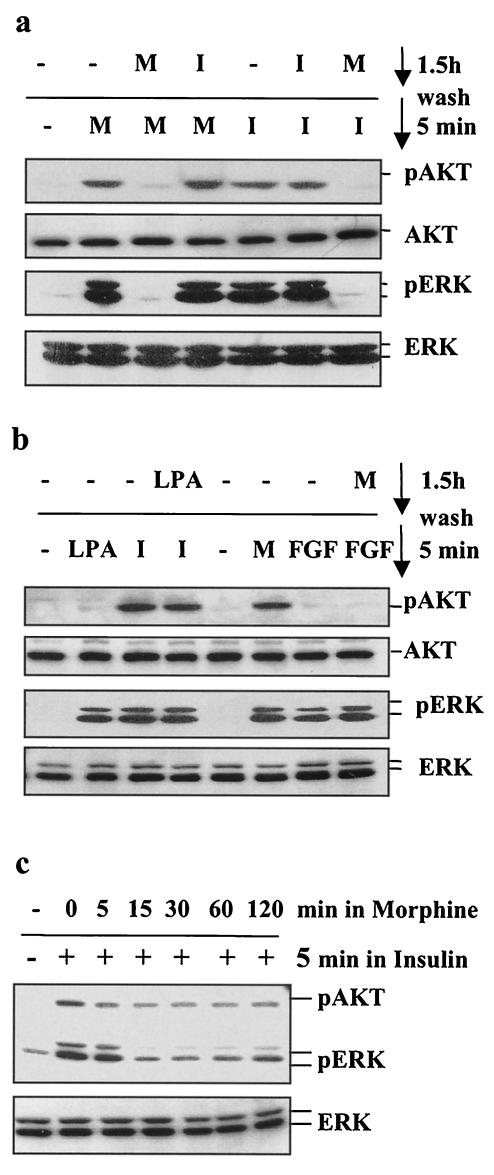
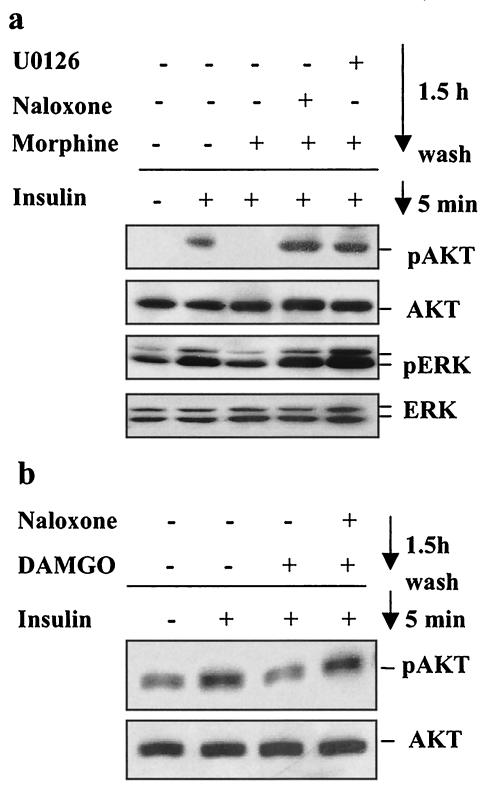
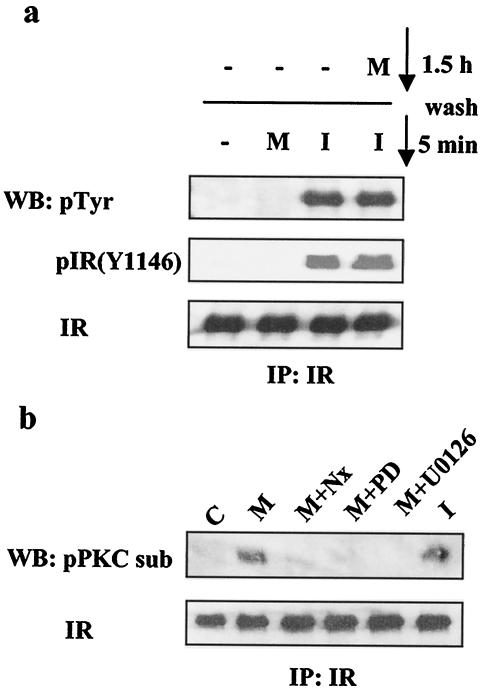
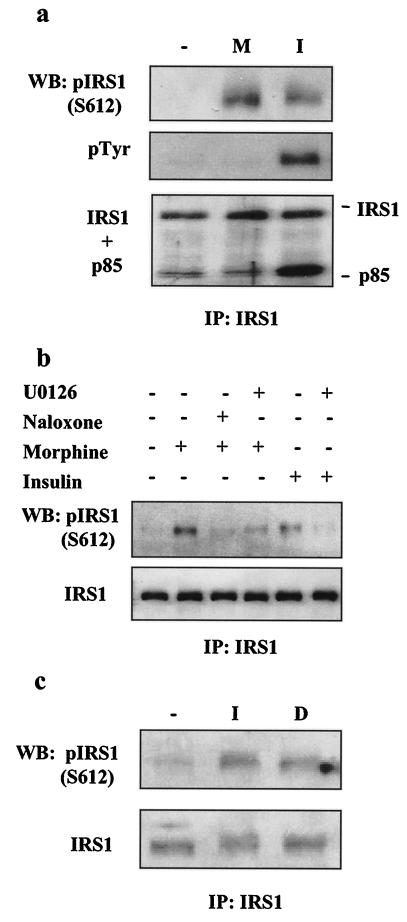
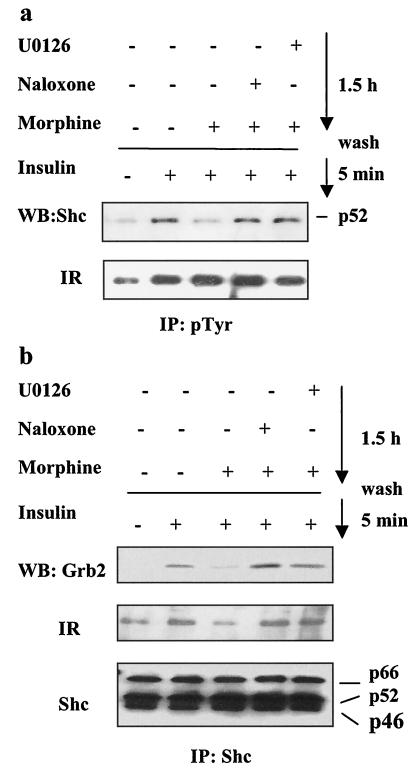
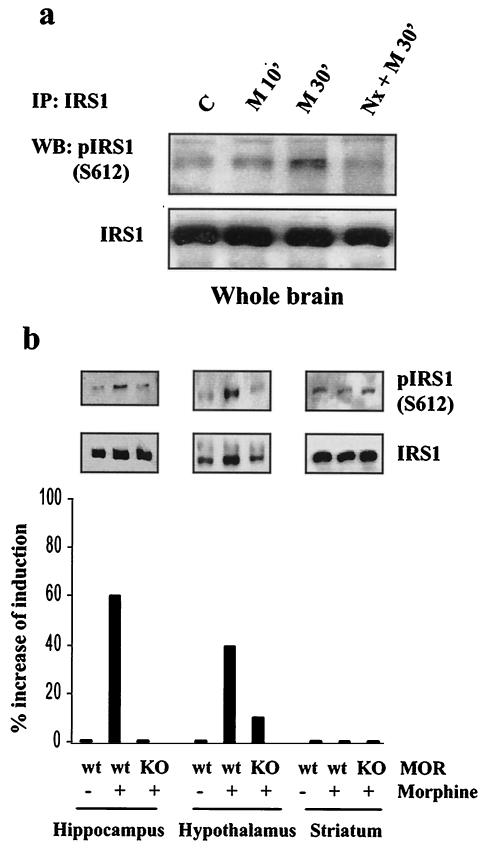
Morphine analgesia is mediated principally by the micro -opioid receptor (MOR). Since morphine and other opiates have been shown to influence glucose homeostasis, we investigated the hypothesis of direct cross talk between the MOR and the insulin receptor (IR) signaling cascades. We show that prolonged morphine exposure of cell lines expressing endogenous or transfected MOR, IR, and the insulin substrate 1 (IRS-1) protein specifically desensitizes IR signaling to Akt and ERK cascades. Morphine caused serine phosphorylation of the IR and impaired the formation of the signaling complex among the IR, Shc, and Grb2. Morphine also resulted in IRS-1 phosphorylation at serine 612 and reduced tyrosine phosphorylation at the YMXM p85-binding motifs, weakening the association of the IRS-1/p85 phosphatidylinositol 3-kinase complex. However, the IRS-1/Grb2 complex was unaffected by chronic morphine treatment. These results suggest that morphine attenuates IR signaling to Akt by disrupting the IRS-1-p85 interaction but inhibits signaling to ERK by disruption of the complex among the IR, Shc, and Grb2. Finally, we show that systemic morphine induced IRS-1 phosphorylation at Ser612 in the hypothalamus and hippocampus of wild type, but not MOR knockout, mice. Our results demonstrate that opiates can inhibit insulin signaling through direct cross talk between the downstream signaling pathways of the MOR and the IR.


Figures

FIG. 1.
FIG. 1.
Induction of Akt and ERK phosphorylation by morphine and insulin. (a) Cells expressing the IR, IRS-1, and the MOR were left untreated (lane C) or treated with DAMGO (lane D; 1 μM), morphine (M; 1 μM), or insulin (I; 200 nM) for 5 min, extracted, and assayed by Western blotting for levels of phospho-Akt (S473), phospho-p90RSK (T573), phospho-ERK (T202/Y204), and phospho-GSK3β (S9), as well as total Akt and ERK. The time courses of Akt and ERK induction by morphine (1 μM; b) and insulin (200 nM; c) are also shown.
FIG. 2.
FIG. 2.
Desensitization of insulin signaling to Akt and ERK by morphine. (a) Cells were treated with morphine (M; 1 μM) or insulin (I; 200 nM) for 1.5 h, washed, subjected to either morphine or insulin for 5 min, and then assayed for levels of phospho-Akt, phospho-ERK, and total Akt and ERK. (b) Cells were treated with morphine (1 μM) or LPA (10 μM) for 1.5 h; washed; exposed to morphine (1 μM), LPA (10 μM), insulin (200 nM), or bFGF (100 ng/ml) for 5 min; and then analyzed for kinase activation. (c) Time course of MOR-mediated desensitization of IR signaling via Akt and ERK. Cells were incubated for various periods of time with 1 μM morphine, washed, subjected to 200 nM insulin for 5 min, and then assayed for phospho-Akt, total Akt, phospho-ERK, and total ERK.
FIG. 3.
FIG. 3.
Inhibition of the ERK pathway blocks desensitization of insulin signaling by morphine. CHO-MOR/IR/IRS-1 (a) or SK-N-SH (b) cells were serum starved overnight and then pretreated with 1 μM morphine (a) or 200 nM DAMGO (b). Morphine and DAMGO pretreatments were performed in the absence or presence of 10 μM naloxone (a and b) or 10 μM U0126 (a). After 1.5 h, the cells were washed three times with serum-free medium and exposed to 200 nM insulin for 5 min. Extracts were then assayed for levels of phospho-Akt (S473), total Akt, phospho-ERK(T202/Y204), and total ERK.
FIG. 4.
FIG. 4.
Effect of morphine on IR phosphorylation. (a) CHO-MOR/IR/IRS-1 cells were serum starved overnight, exposed to morphine (M; 1 μM) or insulin (I; 200 nM) for 5 min or exposed to 1 μM morphine for 1.5 h, washed, and then stimulated with 200 nM insulin for 5 min. Cell lysates were subjected to immunoprecipitation with an anti-IR antibody and then assayed for levels of phospho-Tyr (PY-100) (top), phospho-IR (Y1146) (middle), and total IR (bottom). (b) Cells were serum starved overnight and then treated with 200 nM insulin for 5 min or 1 μM morphine for 1.5 h alone or together with naloxone (Nx; 10 μM) or U0126 (10 μM). Cell lysates were subjected to immunoprecipitation (IP) with anti-IR antibody and then analyzed by Western blotting (WB) with the phospho-PKC substrate (sub) and anti-IR antibodies. C, control; PD, PD98059.
FIG. 5.
FIG. 5.
Serine phosphorylation of IRS-1 by morphine. CHO-MOR/IR/IRS-1 (a and b) or SK-N-SH (c) cells were serum starved overnight and then stimulated with morphine (M; 1 μM) or insulin (I; 200 nM) for 5 min (a), with morphine alone or in the absence or presence of naloxone (10 μM) or U0126 (10 μM) for 1.5 h; or with insulin for 5 min, with or without preincubation with U0126 (10 μM) (b); and with insulin for 5 min or with 200 nM DAMGO (D) for 1.5 h (c). Cell lysates then were immunoprecipitated (IP) with IRS-1 antibodies and analyzed with phospho-IRS1 (S612), phosphotyrosine (PY-100), PI3-kinase p85, and IRS-1 antibodies. WB, Western blot.
FIG. 6.
FIG. 6.
Effect of morphine on the tyrosine phosphorylation of IRS-1. (a) Specificity of p85-binding motif antibody. NIH 3T3 cells were transfected with wild-type and mutant F6-HA-IRS-1 constructs, starved overnight, and treated with insulin (I; 200 nM) for 5 min. Transfected IRS-1 proteins were immunoprecipitated with anti-HA antibodies and analyzed with p85-binding motif (pYMXM; top), general phosphotyrosine (PY-100; middle), or HA (bottom) antibodies. (b) Cell lysates were prepared as described in the legend to Fig. 4a and then subjected to immunoprecipitation (IP) with IRS-1 antibodies, followed by analysis with phospho-p85-binding motif (pYMXM), phosphotyrosine (pY-100), and IRS-1 antibodies. (c) Cell lysates from panel b were analyzed for levels of phospho-Akt (S473) and total Akt. WB, Western blotting.
FIG. 7.
FIG. 7.
Effect of morphine on IRS-1, IR, PI3K, and Grb2 interactions. CHO-MOR/IR/IRS-1 (a) or SK-N-SH (c) cells were treated with morphine or DAMGO, respectively. Cell lysates were then prepared as described in the legend to Fig. 4a, and IRS-1 was immunoprecipitated with IRS-1 antibodies, followed by analysis with IR, p85 PI3-kinase, p85-binding motif, and IRS-1 antibodies. (b) Cell lysates were prepared as described in the legend to Fig. 4a, and IRS-1 was immunoprecipitated (IP) with IRS-1 antibodies and analyzed with anti-Grb2 and IRS-1 antibodies. The same cell lysates were analyzed for levels of phospho-ERK and total ERK (bottom). WB, Western blotting; M, morphine; I, insulin.
FIG. 8.
FIG. 8.
Effect of morphine on Shc, IR, and Grb2 interactions. (a) Cell lysates were prepared as described in the legend to Fig. 4b. The lysates were immunoprecipitated with phosphotyrosine antibodies (PY-100) and then analyzed with anti-Shc and anti-IR antibodies. (b) The same cell lysates as in panel a were immunoprecipitated (IP) with anti-Shc antibody and then analyzed with Grb2, IR, and Shc antibodies. WB, Western blotting.
FIG. 9.
FIG. 9.
Morphine induces IRS-1 phosphorylation at S612 in the mouse brain. Mice were injected s.c. with either saline or 2 mg of naloxone (Nx) per kg, followed by s.c. injection of either saline or 10 mg of morphine (M) per kg 15 min later as described in Materials and Methods. Extracts of whole brains from wild-type mice (a) or hypothalamus, hippocampus, and striatum tissues from wild type (wt) or MOR knockout (KO) mice (b) were prepared, and IRS-1 was immunoprecipitated (IP) with an IRS-1 antibody, followed by analysis with anti-IRS-1 or phospho-IRS1 S612 antibodies. Histograms represent the average percent induction of IRS-1 S612 phosphorylation of two independent experiments normalized for total immunoprecipitated IRS-1. WB, Western blotting; C, control.

Similar articles

Cited by

References

    1. Aberg, M. A., N. D. Aberg, H. Hedbacker, J. Oscarsson, and P. S. Eriksson. 2000. Peripheral infusion of IGF-I selectively induces neurogenesis in the adult rat hippocampus. J. Neurosci. 20:2896-2903. - PMC - PubMed
    1. Aguirre, V., T. Uchida, L. Yenush, R. Davis, and M. F. White. 2000. The c-Jun NH2-terminal kinase promotes insulin resistance during association with insulin receptor substrate-1 and phosphorylation of Ser307. J. Biol. Chem. 275:9047-9054. - PubMed
    1. Aguirre, V., E. D. Werner, J. Giraud, Y. H. Lee, S. E. Shoelson, and M. F. White. 2002. Phosphorylation of Ser307 in insulin receptor substrate-1 blocks interactions with the insulin receptor and inhibits insulin action. J. Biol. Chem. 277:1531-1537. - PubMed
    1. Baumhaker, Y., M. Gafni, O. Keren, and Y. Sarne. 1993. Selective and interactive down-regulation of μ- and δ-opioid receptors in human neuroblastoma SK-N-SH cells. Mol. Pharmacol. 44:461-467. - PubMed
    1. Belcheva, M. M., M. Szucs, D. Wang, W. Sadee, and C. J. Coscia. 2001. μ-Opioid receptor-mediated ERK activation involves calmodulin-dependent epidermal growth factor receptor transactivation. J. Biol. Chem. 276:33847-33853. - PubMed

MeSH terms

Substances