

Voltage- and site-dependent control of the somatic impact of dendritic IPSPs
- PMID: 12917370
- PMCID: PMC6740436
- DOI: 10.1523/JNEUROSCI.23-19-07358.2003
Voltage- and site-dependent control of the somatic impact of dendritic IPSPs
Abstract
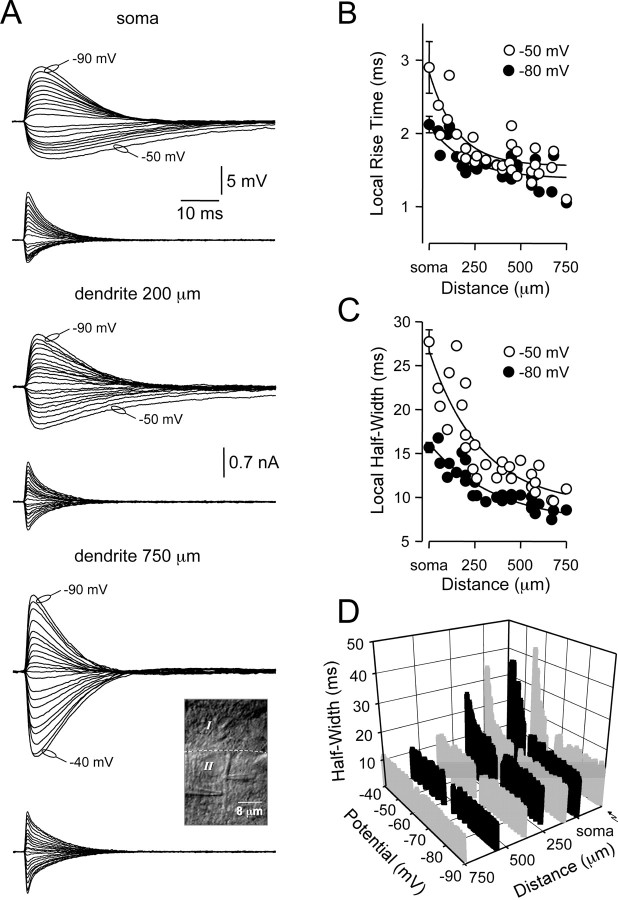
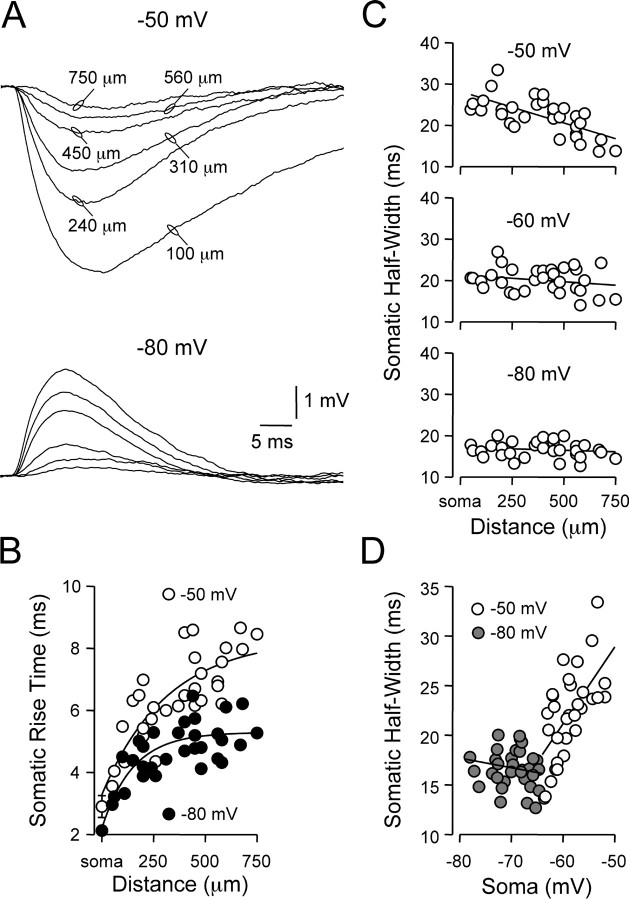
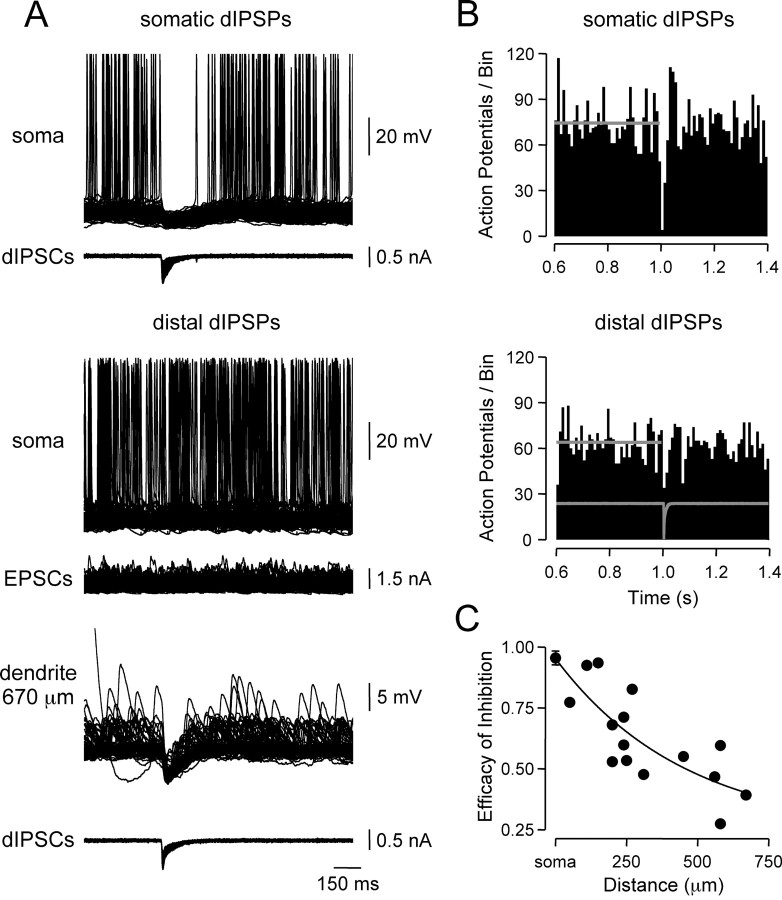
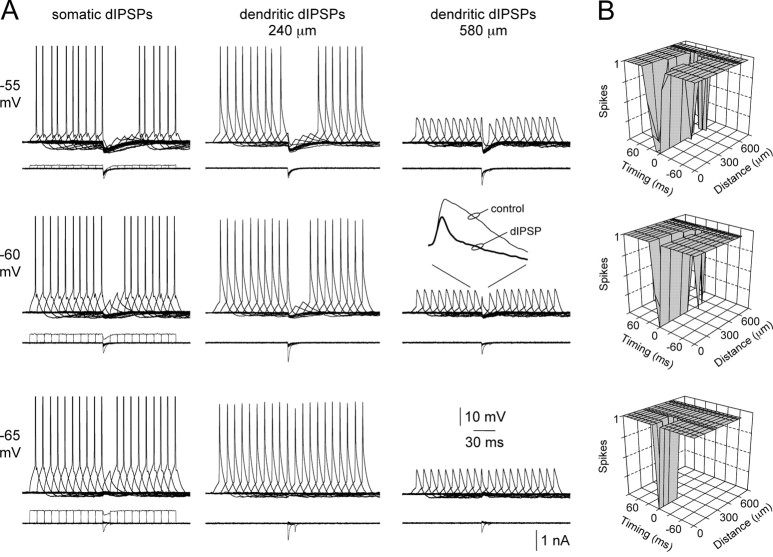
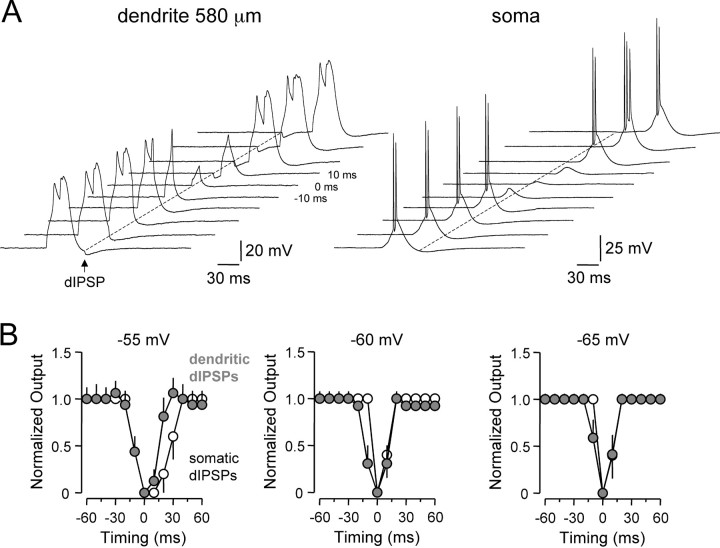
Inhibitory interneurons target specific subcellular compartments of cortical pyramidal neurons, where location-specific interactions of IPSPs with voltage-activated ion channels are likely to influence the inhibitory control of neuronal output. To investigate this, we simulated IPSPs as a conductance source at sites across the somato-apical dendritic axis (up to 750 microm) of neocortical layer 5 pyramidal neurons. Analysis revealed that the electrotonic architecture of cortical pyramidal neurons is highly voltage dependent, resulting in a significant site-dependent disparity between the amplitude, kinetics, and dendro-somatic attenuation of IPSPs generated from depolarized (-50 mV) and hyperpolarized (-80 mV) membrane potentials. At the soma, the time course of IPSPs evoked from depolarized potentials was greatest when generated from proximal dendritic sites and decreased as events were generated more distally, whereas the somatic time course of IPSPs evoked from hyperpolarized potentials was independent of the dendritic site of generation. This behavior resulted from the concerted actions of axo-somatic sodium channels that increased the duration of proximal dendritic IPSPs generated at depolarized potentials and distal dendritic hyperpolarization-activated channels that mediated site independence of somatic IPSP time course at hyperpolarized potentials. Functionally, this voltage-dependent control of IPSPs shaped the spatial and temporal profile of inhibition of axonal action potential firing and dendritic spike generation. Together, these findings demonstrate that the somatic impact of dendritic IPSPs is highly voltage dependent and controlled by classes of ion channels differentially distributed across axodendritic domains, directly revealing site-dependent inhibitory synaptic processing in cortical pyramidal neurons.
Figures
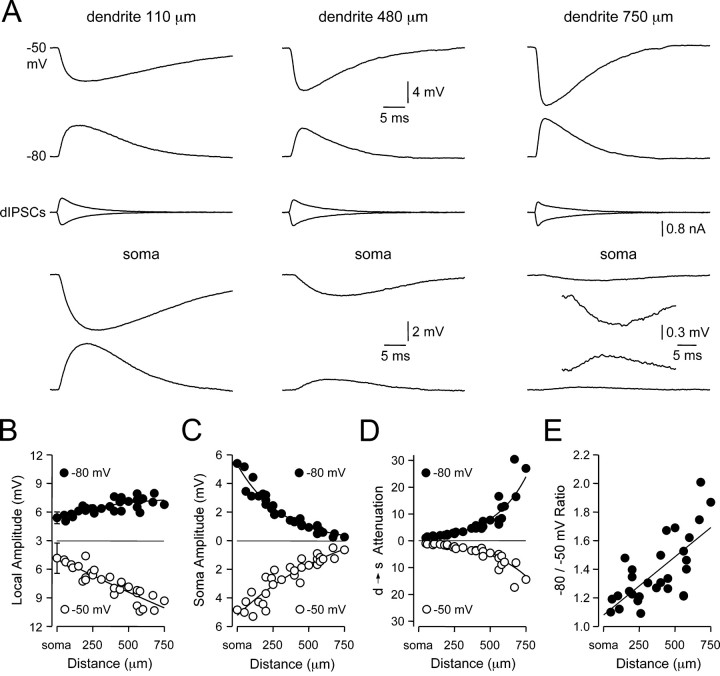
 ). Lines represent linear regression.
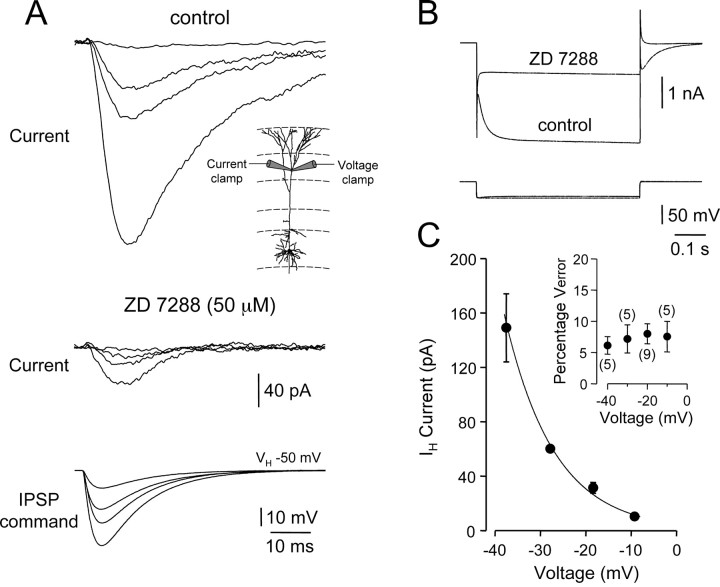
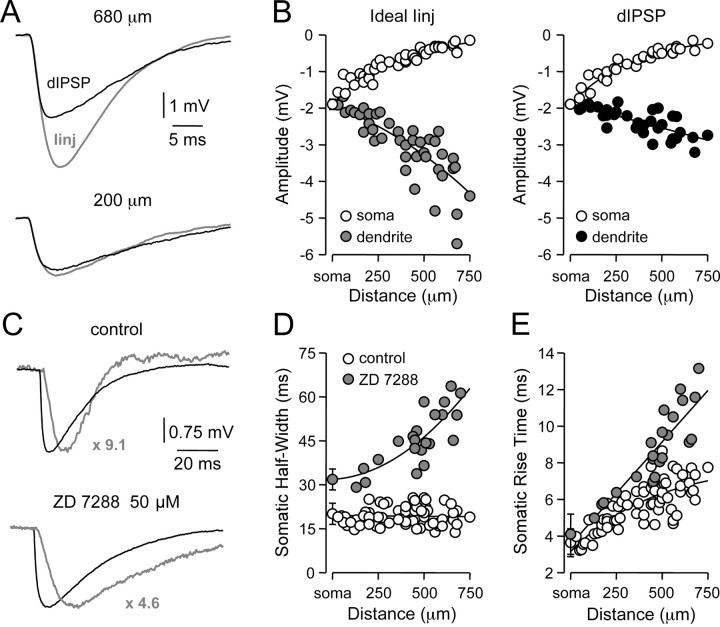 /•) and decrease in somatic (○) amplitude of IPSPs generated with an ideal current source (left) or conductance source (right). C, Comparison of the somatic kinetics after peak scaling of artificial IPSPs generated at dendritic (gray; 680 μm) and somatic sites under control and after IH channel blockade with ZD 7288. The gray figures indicate the dendro-somatic attenuation of dendritic IPSPs. D, Relationship between somatic IPSP time course (half-width) of artificial IPSPs generated under control (○) and after IH channel blockade (
). Lines represent a linear regression (control) and a single exponential (ZD 7288). E, Pooled data showing the site dependence of the somatic rise time (10-90%) of artificial IPSPs under control (○) and following IH channel blockade (
). Lines represent a single exponential (control) and a linear regression (ZD 7288). Somatic points in B, D, and E represent mean ± SD.
/•) and decrease in somatic (○) amplitude of IPSPs generated with an ideal current source (left) or conductance source (right). C, Comparison of the somatic kinetics after peak scaling of artificial IPSPs generated at dendritic (gray; 680 μm) and somatic sites under control and after IH channel blockade with ZD 7288. The gray figures indicate the dendro-somatic attenuation of dendritic IPSPs. D, Relationship between somatic IPSP time course (half-width) of artificial IPSPs generated under control (○) and after IH channel blockade (
). Lines represent a linear regression (control) and a single exponential (ZD 7288). E, Pooled data showing the site dependence of the somatic rise time (10-90%) of artificial IPSPs under control (○) and following IH channel blockade (
). Lines represent a single exponential (control) and a linear regression (ZD 7288). Somatic points in B, D, and E represent mean ± SD.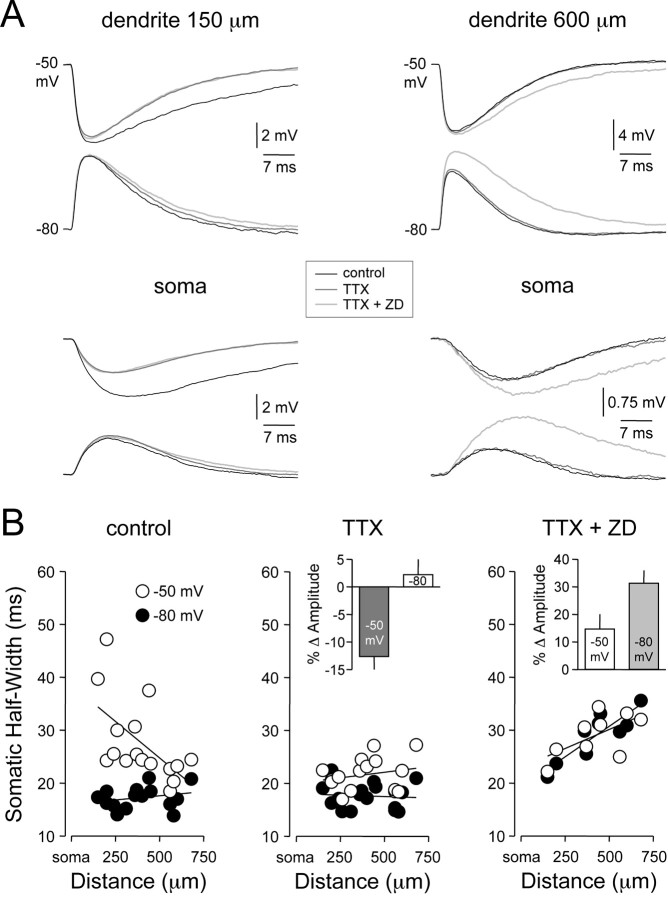
Similar articles
-
Action potential initiation and propagation in rat neocortical pyramidal neurons.J Physiol. 1997 Dec 15;505 ( Pt 3)(Pt 3):617-32. doi: 10.1111/j.1469-7793.1997.617ba.x. J Physiol. 1997. PMID: 9457640 Free PMC article.
-
Inhibitory control of somatodendritic interactions underlying action potentials in neocortical pyramidal neurons in vivo: an intracellular and computational study.Neuroscience. 1998 May;84(2):377-402. doi: 10.1016/s0306-4522(97)00530-7. Neuroscience. 1998. PMID: 9539211
-
Distribution and function of HCN channels in the apical dendritic tuft of neocortical pyramidal neurons.J Neurosci. 2015 Jan 21;35(3):1024-37. doi: 10.1523/JNEUROSCI.2813-14.2015. J Neurosci. 2015. PMID: 25609619 Free PMC article.
-
Role of dendritic synapse location in the control of action potential output.Trends Neurosci. 2003 Mar;26(3):147-54. doi: 10.1016/S0166-2236(03)00035-3. Trends Neurosci. 2003. PMID: 12591217 Review.
-
Inhibitory Postsynaptic Potentials Participate in Intracellular and Extracellular Theta Rhythms in the Hippocampus: A Personal Narrative.Hippocampus. 2025 Jan;35(1):e23660. doi: 10.1002/hipo.23660. Hippocampus. 2025. PMID: 39670347 Review.
Cited by
-
Intrinsic Plasticity Mechanisms of Repetitive Transcranial Magnetic Stimulation.Neuroscientist. 2024 Apr;30(2):260-274. doi: 10.1177/10738584221118262. Epub 2022 Sep 5. Neuroscientist. 2024. PMID: 36059273 Free PMC article. Review.
-
GABA transporter GAT1 prevents spillover at proximal and distal GABA synapses onto primate prefrontal cortex neurons.J Neurophysiol. 2009 Feb;101(2):533-47. doi: 10.1152/jn.91161.2008. Epub 2008 Dec 10. J Neurophysiol. 2009. PMID: 19073797 Free PMC article.
-
The role of negative conductances in neuronal subthreshold properties and synaptic integration.Biophys Rev. 2017 Oct;9(5):827-834. doi: 10.1007/s12551-017-0300-8. Epub 2017 Aug 14. Biophys Rev. 2017. PMID: 28808978 Free PMC article. Review.
-
Unitary IPSPs enhance hilar mossy cell gain in the rat hippocampus.J Physiol. 2007 Jan 15;578(Pt 2):451-70. doi: 10.1113/jphysiol.2006.121608. Epub 2006 Nov 2. J Physiol. 2007. PMID: 17082230 Free PMC article.
-
Local and global effects of I(h) distribution in dendrites of mammalian neurons.J Neurosci. 2007 Aug 8;27(32):8643-53. doi: 10.1523/JNEUROSCI.5284-06.2007. J Neurosci. 2007. PMID: 17687042 Free PMC article.
References
-
- Berger T, Larkum ME, Luscher HR ( 2001) High I(h) channel density in the distal apical dendrite of layer V pyramidal cells increases bidirectional attenuation of EPSPs. J Neurophysiol 85: 855-868. - PubMed
-
- Buhl EH, Halasy K, Somogyi P ( 1994) Diverse sources of hippocampal unitary inhibitory postsynaptic potentials and the number of synaptic release sites. Nature 368: 823-828. - PubMed
Publication types
MeSH terms
Substances
Grants and funding
LinkOut - more resources
Full Text Sources