. 2003 Aug 13;23(19):7395-406.
doi: 10.1523/JNEUROSCI.23-19-07395.2003.

The retinotopic organization of primate dorsal V4 and surrounding areas: A functional magnetic resonance imaging study in awake monkeys

Affiliations

The retinotopic organization of primate dorsal V4 and surrounding areas: A functional magnetic resonance imaging study in awake monkeys

Denis Fize et al. J Neurosci. .

Abstract

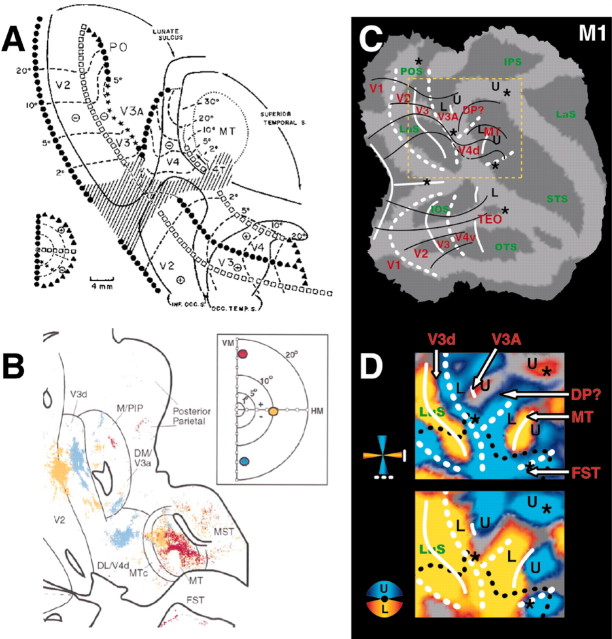
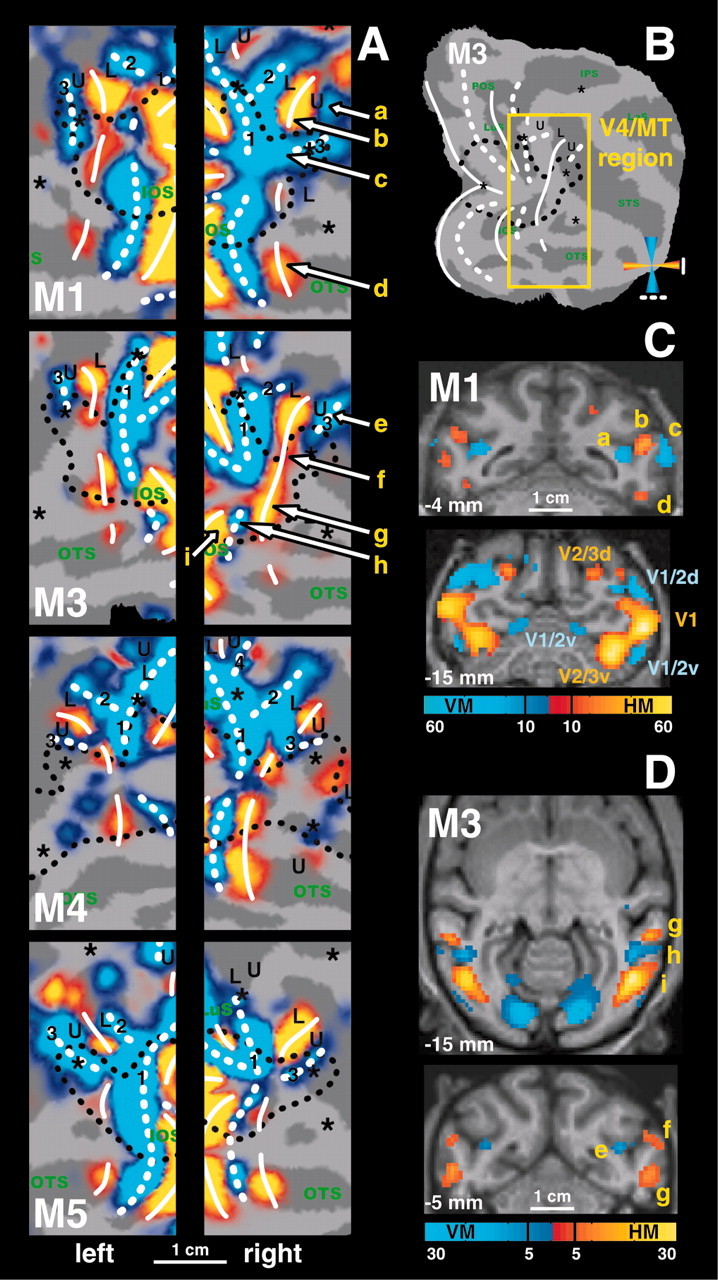
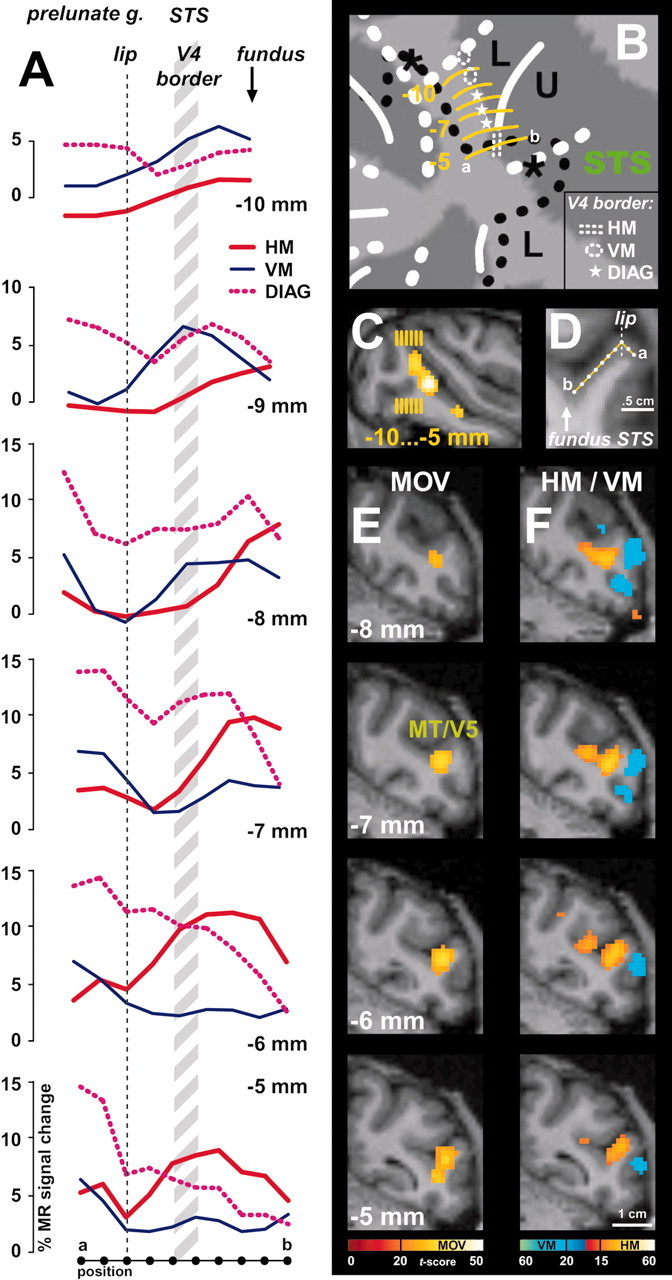
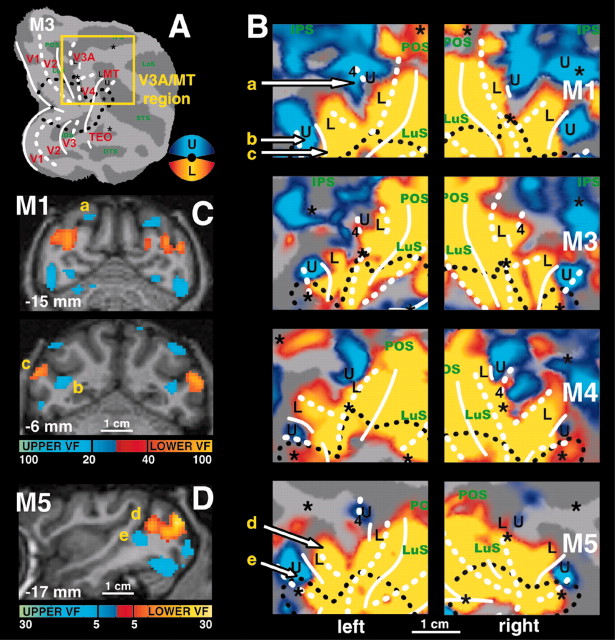
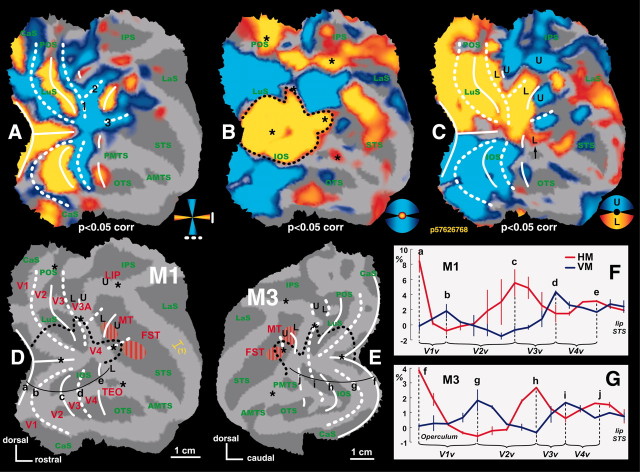
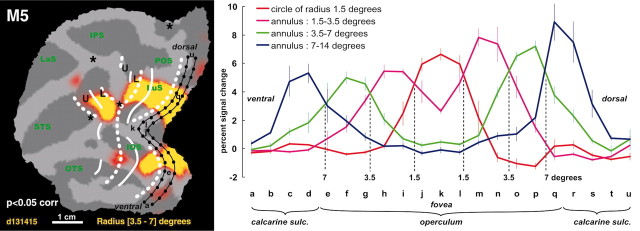
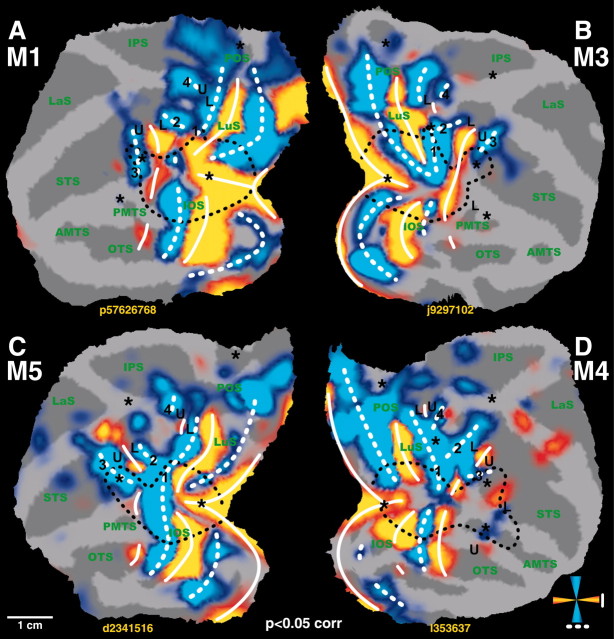
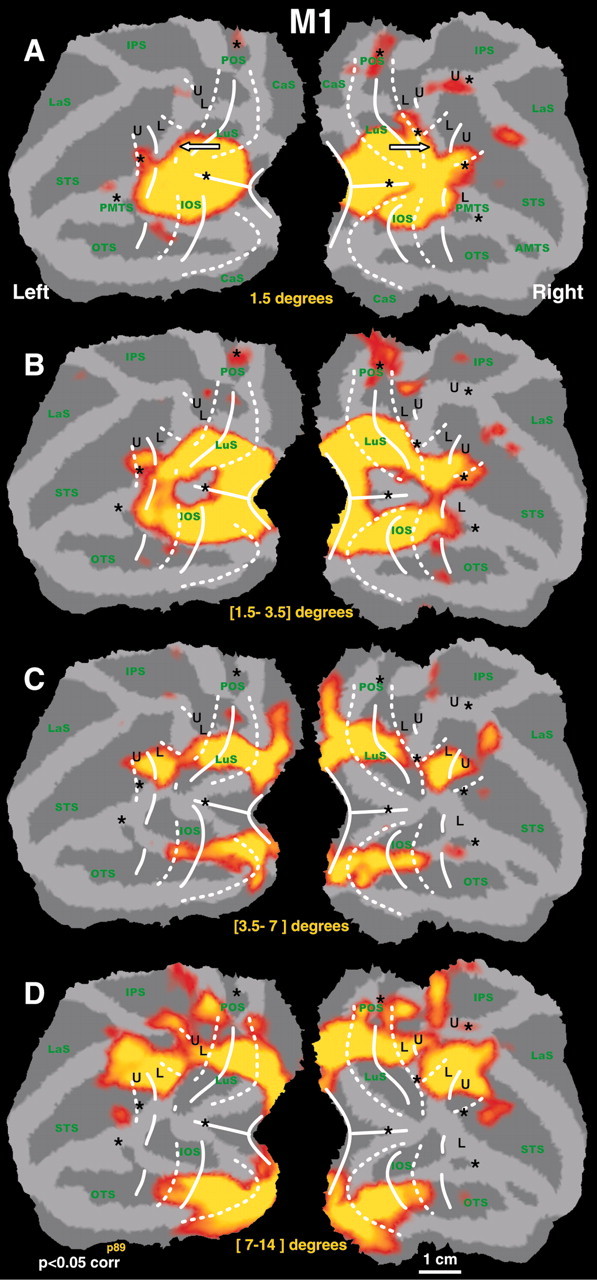
Using functional magnetic resonance imaging (fMRI), we mapped the retinotopic organization throughout the visual cortex of fixating monkeys. The retinotopy observed in areas V1, V2, and V3 was completely consistent with the classical view. V1 and V3 were bordered rostrally by a vertical meridian representation, and V2 was bordered by a horizontal meridian. More anterior in occipital cortex, both areas V3A and MT-V5 had lower and upper visual field representations split by a horizontal meridian. The rostral border of dorsal V4 was characterized by the gradual transition of a representation of the vertical meridian (dorsally) to a representation of the horizontal meridian (more ventrally). Central and ventral V4, on the other hand, were rostrally bordered by a representation of the horizontal meridian. The eccentricity lines ran perpendicular to the ventral V3-V4 border but were parallel to the dorsal V3-V4 border. These results indicate different retinotopic organizations within dorsal and ventral V4, suggesting that the latter regions may not be merely the lower and upper visual field representations of a single area. Moreover, because the present fMRI data are in agreement with previously published electrophysiological results, reported distinctions in the retinotopic organization of human and monkey dorsal V4 reflect genuine species differences that cannot be attributed to technical confounds. Finally, aside from dorsal V4, the retinotopic organization of macaque early visual cortex (V1, V2, V3, V3A, and ventral V4) is remarkably similar to that observed in human fMRI studies. This finding indicates that early visual cortex is mostly conserved throughout hominid evolution.


Figures

Figure 8.
Figure 8.
Comparison between our fMRI and previous electrophysiological results and connections patterns. A, Figure from Gattass et al. (1988) (reproduced with permission). The results from this electrophysiological retinotopic mapping experiment show a pattern of iso-eccentricity lines similar to that observed in the present study (see iso-eccentricity lines in C). B, Figure showing projections of VM and HM in V3A, V4, and MT-V5, extracted from Lyon and Kaas (2002) (reproduced with permission). C, Iso-eccentricity lines in right hemisphere of M1 derived from Figure 5. D, Close-up view of the horizontal and vertical meridians, upper and lower visual field representations around dorsal V4 (M1).
Figure 3.
Figure 3.
Horizontal and vertical meridian representations in area V4 and neighboring cortex. A, T-score maps (p < 0.05, corrected for multiple comparisons) for horizontal (yellow code) and vertical (blue code) meridian representations are imposed on the flattened cortical reconstructions of the left hemispheres and right hemispheres of the four subjects. Same conventions as in Figure 1. The location of the region of interest is shown in B. Yellow labels and arrows indicate locations shown in the coronal and horizontal brain sections in C and D. C, Coronal brain sections of M1 showing horizontal meridian (yellow code) and vertical meridian (blue code) driven activity. The coronal section at -15 mm can be compared with the one of Figure 5C in the same animal (for the UVF-LVF and the LVF-UVF comparison). D, Horizontal and coronal brain sections of M3.
Figure 4.
Figure 4.
Anterior border of dorsal V4. A, Plots of percentage MR signal change for horizontal meridian (HM, red plot), vertical meridian (VM, blue plot), and the 45°“diagonal” (DIAG, dashed pink plot) stimuli in monkey M1 from the middle of the prelunate gyrus toward the fundus of the STS. The data points were sampled from coronal sections of the prelunate gyrus as indicated by the yellow lines in B-D. Percentage signal changes are relative to the no-stimulus baseline condition. The anterior border of V4 was estimated to be at ∼2-3 mm from the caudal lip of the STS (A, gray hatched zone). B-D, Localization of the coronal slices from which the data, as shown in A, were sampled. One example of a sampling path is shown in a portion of a coronal section in D (from location a → b, as indicated in B,D, and the bottom of A). Samples were taken 1 mm apart from each other. E, Motion-related activity in the same region of M1 (by comparing moving versus stationary random texture patterns) (Vanduffel et al., 2001). The moving stimulus activates MT-V5 in this portion of the STS. F, Horizontal (yellow color code, for the comparison HM-VM) and vertical (blue color-code, for the comparison VM-HM) meridian representations for the same slices as in E.
Figure 5.
Figure 5.
Lower and upper visual field representations in the dorsal anterior visual cortex. A, Summary view of the right hemisphere of M3. Same conventions as in Figures 1 and 2. The yellow box indicates the position of the detailed activity maps of all four monkeys as shown in B. B, Upper (blue color code) and lower (yellow color code) visual field representations (p < 0.05, corrected for multiple comparisons) in the dorsal anterior cortex of the eight hemispheres (left hemisphere is on the left, right hemisphere on the right). Yellow labels and arrows indicate locations shown in the brain sections in C and D. C, Upper (blue) and lower (yellow) visual fields representations overlaid onto coronal brain sections of M1. The activities are highly thresholded to obtain good spatial specificity and to visualize the underlying anatomy. Horsley-Clarke coordinates are indicated on the left bottom of each section. Left hemisphere is on the left. Scale bars represent t-scores. D, Sagittal brain section of the left hemisphere of M3; same conventions as C.
Figure 1.
Figure 1.
Representation of meridians, central and peripheral, and upper and lower visual field. A, T-score map of horizontal (red-yellow color code: HM-VM) and vertical (blue color code: VM-HM) meridian representations. The activations driven by stimuli confined to the meridians are represented as t-score maps (p < 0.05, corrected for multiple comparisons) on the flattened cortical reconstruction (dark gray: sulci; light gray: gyri). White solid and dashed lines represent the horizontal and vertical meridians, respectively. Labels 1-3 correspond to different VM representations in the region surrounding the prelunate gyrus. B, Significance map for central (red-yellow: central-peripheral VF) and peripheral visual stimulation (blue: peripheral-central VF). Black dashed line indicates the contour of the central 1.5° eccentricity line. Stars indicate additional foveal activations (p < 0.05, corrected for multiple comparisons). C, Significance map for upper (blue: upper-lower VF) and lower (red-yellow: lower-upper VF) visual field representations. “L” and “U” labels indicate the locations of lower and upper field representations. D, E, Summary of visual field maps for M1 (right hemisphere) and M3 (left hemisphere) on the basis of tests as illustrated in A-C. Red labels indicate the visual areas defined by either anatomical location or known visual field representation (V1-4, V3A, LIP) and anatomical location and motion sensitivity (MT-V5, FST). F, G, Plots of percentage MR signal change related to horizontal (red) and vertical (blue) meridian relative to the no-stimulus condition as sampled along the lines indicated in D (a-e) and E (f-j). Error bars represent SEM between the left and right hemispheres. IOS, Inferior occipital sulcus; OTS, occipitotemporal sulcus; STS, superior temporal sulcus; LaS, lateral sulcus; IPS, intraparietal sulcus; POS, parieto-occipital sulcus; LuS, lunate sulcus. (1) The extent of light gray on the anatomical representations could give a misleading estimation of the width of the gyri. A more realistic extent of the gyrus is represented by the yellow ruler in D. This remark holds true for all gyri of all flat maps.
Figure 7.
Figure 7.
Eccentricity in area V1. A, Significance map of the activity driven by the [3.5-7]° annulus in M5 (as compared with all other annuli). The iso-eccentricity lines were very similar to those of M1. Black dots represent the sampling points (3 mm ± 0.3) along two lines running parallel to the meridians of area V1. The percentage signal change relative to the no-stimulus condition for the four different stimuli at these points are plotted in B. The locations of 1.5, 3.5, and 7° eccentricity were defined as the intersections of the activity profiles.
Figure 2.
Figure 2.
Representation of meridians. T-score maps (p < 0.05, corrected for multiple comparisons) of horizontal (red-yellow) and vertical (blue) meridian representations are presented on the flattened cortical reconstructions of the left hemispheres of M1 and M5 and right hemispheres of M3 and M4. Label 4 corresponds to the putative anterior border of V3A. Same conventions as in Figure 1.
Figure 6.
Figure 6.
Eccentricity maps for left and right hemispheres of M1. A, T-score maps (p < 0.05, corrected for multiple comparisons) for the central visual field stimulus (1.5° radius). B-D, The activity maps revealed by annuli with a radius of [1.5-3.5], [3.5-7], and [7-14]°, respectively [the respective contrast was always relative to all other annuli types: e.g., (central stimulus) - (all annuli)]. The iso-eccentricity lines, defined by the borders of each activity pattern, were perpendicular to the meridians in the early areas. In dorsal V4, the iso-eccentricity lines run nearly parallel to the areal boundaries (see arrows). Same conventions as in Figure 1.

Similar articles

Cited by

References

    1. Andersen RA, Asanuma C, Essick G, Siegel RM ( 1990) Corticocortical connections of anatomically and physiologically defined subdivisions within the inferior parietal lobule. J Comp Neurol 296: 65-113. - PubMed
    1. Bartels A, Zeki S ( 2000) The architecture of the colour centre in the human visual brain: new results and a review. Eur J Neurosci 12: 172-193. - PubMed
    1. Ben Hamed S, Duhamel JR, Bremmer F, Graf W ( 2001) Representation of the visual field in the lateral intraparietal area of macaque monkeys: a quantitative receptive field analysis. Exp Brain Res 140: 127-144. - PubMed
    1. Blatt GJ, Andersen RA, Stoner GR ( 1990) Visual receptive field organization and cortico-cortical connections of the lateral intraparietal area (area LIP) in the macaque. J Comp Neurol 299: 421-445. - PubMed
    1. Boussaoud D, Ungerleider LG, Desimone R ( 1990) Pathways for motion analysis: cortical connections of the medial superior temporal and fundus of the superior temporal visual areas in the macaque. J Comp Neurol 296: 462-495. - PubMed

Publication types

LinkOut - more resources